
使用 dplyr 处理和分析数据
最后更新于 2026-11-07 | 编辑此页
概述
问题
- 使用 tidyverse 元包进行 R 数据分析
学习目标
- 描述
dplyr和tidyr包的用途。 - 描述其中几个对于数据处理极其有用的函数。
- 介绍宽格式和长格式的概念,并学习如何将数据框从一种格式重塑为另一种格式。
- 演示如何合并表格。
本集基于 Data Carpentries 的 Data Analysis and Visualisation in R for Ecologists 课程。
使用 dplyr 和
tidyr 进行数据处理
方括号子集选择虽然方便,但可能会显得繁琐且难以阅读,尤其是对于复杂的操作。
在处理数据时,某些包可以大大简化我们的工作。R
中的包基本上是一组额外的函数,让你能够完成更多操作。我们目前使用的函数(如
str() 或 data.frame())是 R
内置的;加载包可以让你使用其他特定函数。在首次使用某个包之前,你需要先在机器上安装它,然后在随后的每次
R 会话中,在需要时将其导入。
dplyr包为数据处理任务提供了强大的工具。它专为直接操作数据框而设计,许多处理任务均经过优化。正如我们稍后将看到的,有时我们需要重塑数据框,以便进行某些特定的分析或进行可视化。
tidyr包解决了这一常见的数据重塑问题,并提供了以整洁的方式操作数据的工具。
在工作坊结束后,如需进一步了解 dplyr 和
tidyr,您可以查阅这份 关于
dplyr 数据转换的实用速查表 以及这份 关于
tidyr 的速查表。
-
tidyverse包是一个“伞形包”,用于安装多个适用于数据分析且能良好协同工作的实用包,例如tidyr、dplyr、ggplot2、tibble等。这些包能帮助我们处理数据并与之交互。它们让我们能够对数据进行许多操作,例如子集提取、转换、可视化等。
如果您已完成设置,应该已经安装了 tidyverse 包。请尝试从库中加载它,以确认是否已安装:
R
## load the tidyverse packages, incl. dplyr
library("tidyverse")
如果您收到了 there is no package called ‘tidyverse’
错误消息,则表示您尚未为此版本的 R 安装该软件包。要安装
tidyverse 软件包,请输入:
R
BiocManager::install("tidyverse")
如果您需要安装 tidyverse
包,请记得在本次 R 会话中使用上述 library()
命令将其加载!
使用 tidyverse 加载数据
我们将不使用 read.csv(),而是使用 tidyverse 包
readr 中的 read_csv()
函数(请注意使用的是 _ 而非
.)来读取数据。
R
rna <- read_csv("data/rnaseq.csv")

## view the data
rna
输出
# A tibble: 32,428 × 19
   gene    sample  expression organism   age sex   infection strain  time tissue
   <chr>   <chr>        <dbl> <chr>    <dbl> <chr> <chr>     <chr>  <dbl> <chr>
 1 Asl     GSM254…       1170 Mus mus…     8 Fema… Influenz… C57BL…     8 Cereb…
 2 Apod    GSM254…      36194 Mus mus…     8 Fema… Influenz… C57BL…     8 Cereb…
 3 Cyp2d22 GSM254…       4060 Mus mus…     8 Fema… Influenz… C57BL…     8 Cereb…
 4 Klk6    GSM254…        287 Mus mus…     8 Fema… Influenz… C57BL…     8 Cereb…
 5 Fcrls   GSM254…         85 Mus mus…     8 Fema… Influenz… C57BL…     8 Cereb…
 6 Slc2a4  GSM254…        782 Mus mus…     8 Fema… Influenz… C57BL…     8 Cereb…
 7 Exd2    GSM254…       1619 Mus mus…     8 Fema… Influenz… C57BL…     8 Cereb…
 8 Gjc2    GSM254…        288 Mus mus…     8 Fema… Influenz… C57BL…     8 Cereb…
 9 Plp1    GSM254…      43217 Mus mus…     8 Fema… Influenz… C57BL…     8 Cereb…
10 Gnb4    GSM254…       1071 Mus mus…     8 Fema… Influenz… C57BL…     8 Cereb…
# ℹ 32,418 more rows
# ℹ 9 more variables: mouse <dbl>, ENTREZID <dbl>, product <chr>,
#   ensembl_gene_id <chr>, external_synonym <chr>, chromosome_name <chr>,
#   gene_biotype <chr>, phenotype_description <chr>,
#   hsapiens_homolog_associated_gene_name <chr>
请注意,数据的类型现在被称为“tibble”。
Tibbles 对我们之前介绍的数据框对象的一些行为进行了微调。其数据结构与数据框非常相似。就我们的用途而言,唯一的区别在于:
它会在每列名称下显示其数据类型。请注意,<
dbl> 是定义用于存储带有小数点的数值的数据类型。它仅打印前几行数据,且仅打印能容纳在单个屏幕上的列数。
现在我们将学习一些最常用的 dplyr
函数:
-
select(): 子集列 -
filter(): 根据条件筛选行 -
mutate():利用其他列的信息创建新列 -
group_by()和summarise():对分组数据生成汇总统计量 -
arrange(): 对结果进行排序 -
count():统计离散值
选择列与过滤行
若要选择数据框的列,请使用
select()。该函数的第一个参数是数据框
(rna),后续参数则是要保留的列。
R
select(rna, gene, sample, tissue, expression)
输出
# A tibble: 32,428 × 4
   gene    sample     tissue     expression
   <chr>   <chr>      <chr>           <dbl>
 1 Asl     GSM2545336 Cerebellum       1170
 2 Apod    GSM2545336 Cerebellum      36194
 3 Cyp2d22 GSM2545336 Cerebellum       4060
 4 Klk6    GSM2545336 Cerebellum        287
 5 Fcrls   GSM2545336 Cerebellum         85
 6 Slc2a4  GSM2545336 Cerebellum        782
 7 Exd2    GSM2545336 Cerebellum       1619
 8 Gjc2    GSM2545336 Cerebellum        288
 9 Plp1    GSM2545336 Cerebellum      43217
10 Gnb4    GSM2545336 Cerebellum       1071
# ℹ 32,418 more rows
若要选择除某些列之外的所有列,请在变量前加上“-”以将其排除。
R
select(rna, -tissue, -organism)
输出
# A tibble: 32,428 × 17
   gene    sample   expression   age sex   infection strain  time mouse ENTREZID
   <chr>   <chr>         <dbl> <dbl> <chr> <chr>     <chr>  <dbl> <dbl>    <dbl>
 1 Asl     GSM2545…       1170     8 Fema… Influenz… C57BL…     8    14   109900
 2 Apod    GSM2545…      36194     8 Fema… Influenz… C57BL…     8    14    11815
 3 Cyp2d22 GSM2545…       4060     8 Fema… Influenz… C57BL…     8    14    56448
 4 Klk6    GSM2545…        287     8 Fema… Influenz… C57BL…     8    14    19144
 5 Fcrls   GSM2545…         85     8 Fema… Influenz… C57BL…     8    14    80891
 6 Slc2a4  GSM2545…        782     8 Fema… Influenz… C57BL…     8    14    20528
 7 Exd2    GSM2545…       1619     8 Fema… Influenz… C57BL…     8    14    97827
 8 Gjc2    GSM2545…        288     8 Fema… Influenz… C57BL…     8    14   118454
 9 Plp1    GSM2545…      43217     8 Fema… Influenz… C57BL…     8    14    18823
10 Gnb4    GSM2545…       1071     8 Fema… Influenz… C57BL…     8    14    14696
# ℹ 32,418 more rows
# ℹ 7 more variables: product <chr>, ensembl_gene_id <chr>,
#   external_synonym <chr>, chromosome_name <chr>, gene_biotype <chr>,
#   phenotype_description <chr>, hsapiens_homolog_associated_gene_name <chr>
这将选择 rna 中除 tissue 和
organism 之外的所有变量。
若要根据特定条件选择行,请使用 filter():
R
filter(rna, sex == "Male")
输出
# A tibble: 14,740 × 19
   gene    sample  expression organism   age sex   infection strain  time tissue
   <chr>   <chr>        <dbl> <chr>    <dbl> <chr> <chr>     <chr>  <dbl> <chr>
 1 Asl     GSM254…        626 Mus mus…     8 Male  Influenz… C57BL…     4 Cereb…
 2 Apod    GSM254…      13021 Mus mus…     8 Male  Influenz… C57BL…     4 Cereb…
 3 Cyp2d22 GSM254…       2171 Mus mus…     8 Male  Influenz… C57BL…     4 Cereb…
 4 Klk6    GSM254…        448 Mus mus…     8 Male  Influenz… C57BL…     4 Cereb…
 5 Fcrls   GSM254…        180 Mus mus…     8 Male  Influenz… C57BL…     4 Cereb…
 6 Slc2a4  GSM254…        313 Mus mus…     8 Male  Influenz… C57BL…     4 Cereb…
 7 Exd2    GSM254…       2366 Mus mus…     8 Male  Influenz… C57BL…     4 Cereb…
 8 Gjc2    GSM254…        310 Mus mus…     8 Male  Influenz… C57BL…     4 Cereb…
 9 Plp1    GSM254…      53126 Mus mus…     8 Male  Influenz… C57BL…     4 Cereb…
10 Gnb4    GSM254…       1355 Mus mus…     8 Male  Influenz… C57BL…     4 Cereb…
# ℹ 14,730 more rows
# ℹ 9 more variables: mouse <dbl>, ENTREZID <dbl>, product <chr>,
#   ensembl_gene_id <chr>, external_synonym <chr>, chromosome_name <chr>,
#   gene_biotype <chr>, phenotype_description <chr>,
#   hsapiens_homolog_associated_gene_name <chr>
R
filter(rna, sex == "Male" & infection == "NonInfected")
输出
# A tibble: 4,422 × 19
   gene    sample  expression organism   age sex   infection strain  time tissue
   <chr>   <chr>        <dbl> <chr>    <dbl> <chr> <chr>     <chr>  <dbl> <chr>
 1 Asl     GSM254…        535 Mus mus…     8 Male  NonInfec… C57BL…     0 Cereb…
 2 Apod    GSM254…      13668 Mus mus…     8 Male  NonInfec… C57BL…     0 Cereb…
 3 Cyp2d22 GSM254…       2008 Mus mus…     8 Male  NonInfec… C57BL…     0 Cereb…
 4 Klk6    GSM254…       1101 Mus mus…     8 Male  NonInfec… C57BL…     0 Cereb…
 5 Fcrls   GSM254…        375 Mus mus…     8 Male  NonInfec… C57BL…     0 Cereb…
 6 Slc2a4  GSM254…        249 Mus mus…     8 Male  NonInfec… C57BL…     0 Cereb…
 7 Exd2    GSM254…       3126 Mus mus…     8 Male  NonInfec… C57BL…     0 Cereb…
 8 Gjc2    GSM254…        791 Mus mus…     8 Male  NonInfec… C57BL…     0 Cereb…
 9 Plp1    GSM254…      98658 Mus mus…     8 Male  NonInfec… C57BL…     0 Cereb…
10 Gnb4    GSM254…       2437 Mus mus…     8 Male  NonInfec… C57BL…     0 Cereb…
# ℹ 4,412 more rows
# ℹ 9 more variables: mouse <dbl>, ENTREZID <dbl>, product <chr>,
#   ensembl_gene_id <chr>, external_synonym <chr>, chromosome_name <chr>,
#   gene_biotype <chr>, phenotype_description <chr>,
#   hsapiens_homolog_associated_gene_name <chr>
现在,假设我们想了解该数据集中分析的小鼠基因的人类同源基因。这些信息可以在
rna tibble 的最后一列(名为
hsapiens_homolog_associated_gene_name)中找到。为了便于可视化,我们将创建一个仅包含
gene 和 hsapiens_homolog_associated_gene_name
这两个列的新表。
R
genes <- select(rna, gene, hsapiens_homolog_associated_gene_name)
genes
输出
# A tibble: 32,428 × 2
   gene    hsapiens_homolog_associated_gene_name
   <chr>   <chr>
 1 Asl     ASL
 2 Apod    APOD
 3 Cyp2d22 CYP2D6
 4 Klk6    KLK6
 5 Fcrls   FCRL2
 6 Slc2a4  SLC2A4
 7 Exd2    EXD2
 8 Gjc2    GJC2
 9 Plp1    PLP1
10 Gnb4    GNB4
# ℹ 32,418 more rows
某些小鼠基因没有人类同源基因。可以使用 filter() 和
is.na() 函数来检索这些基因,后者用于判定某项是否为
NA。
R
filter(genes, is.na(hsapiens_homolog_associated_gene_name))
输出
# A tibble: 4,290 × 2
   gene     hsapiens_homolog_associated_gene_name
   <chr>    <chr>
 1 Prodh    <NA>
 2 Tssk5    <NA>
 3 Vmn2r1   <NA>
 4 Gm10654  <NA>
 5 Hexa     <NA>
 6 Sult1a1  <NA>
 7 Gm6277   <NA>
 8 Tmem198b <NA>
 9 Adam1a   <NA>
10 Ebp      <NA>
# ℹ 4,280 more rows
如果我们只想保留具有人类同源基因的小鼠基因,可以插入一个“!”符号来取反结果,这样我们就在查询所有
hsapiens_homolog_associated_gene_name 不是 NA
的行。
R
filter(genes, !is.na(hsapiens_homolog_associated_gene_name))
输出
# A tibble: 28,138 × 2
   gene    hsapiens_homolog_associated_gene_name
   <chr>   <chr>
 1 Asl     ASL
 2 Apod    APOD
 3 Cyp2d22 CYP2D6
 4 Klk6    KLK6
 5 Fcrls   FCRL2
 6 Slc2a4  SLC2A4
 7 Exd2    EXD2
 8 Gjc2    GJC2
 9 Plp1    PLP1
10 Gnb4    GNB4
# ℹ 28,128 more rows
管道
如果想同时进行选择和过滤怎么办?有三种方法:使用中间步骤、嵌套函数或管道。
使用中间步骤时,你会创建一个临时数据框,并将其作为下一个函数的输入,如下所示:
R
rna2 <- filter(rna, sex == "Male")
rna3 <- select(rna2, gene, sample, tissue, expression)
rna3
输出
# A tibble: 14,740 × 4
   gene    sample     tissue     expression
   <chr>   <chr>      <chr>           <dbl>
 1 Asl     GSM2545340 Cerebellum        626
 2 Apod    GSM2545340 Cerebellum      13021
 3 Cyp2d22 GSM2545340 Cerebellum       2171
 4 Klk6    GSM2545340 Cerebellum        448
 5 Fcrls   GSM2545340 Cerebellum        180
 6 Slc2a4  GSM2545340 Cerebellum        313
 7 Exd2    GSM2545340 Cerebellum       2366
 8 Gjc2    GSM2545340 Cerebellum        310
 9 Plp1    GSM2545340 Cerebellum      53126
10 Gnb4    GSM2545340 Cerebellum       1355
# ℹ 14,730 more rows
这种写法易于阅读,但可能会因为需要为大量中间对象分别命名而使工作区变得杂乱。在涉及多个步骤时,这可能很难跟踪。
你还可以嵌套函数(即一个函数在另一个函数中),如下所示:
R
rna3 <- select(filter(rna, sex == "Male"), gene, sample, tissue, expression)
rna3
输出
# A tibble: 14,740 × 4
   gene    sample     tissue     expression
   <chr>   <chr>      <chr>           <dbl>
 1 Asl     GSM2545340 Cerebellum        626
 2 Apod    GSM2545340 Cerebellum      13021
 3 Cyp2d22 GSM2545340 Cerebellum       2171
 4 Klk6    GSM2545340 Cerebellum        448
 5 Fcrls   GSM2545340 Cerebellum        180
 6 Slc2a4  GSM2545340 Cerebellum        313
 7 Exd2    GSM2545340 Cerebellum       2366
 8 Gjc2    GSM2545340 Cerebellum        310
 9 Plp1    GSM2545340 Cerebellum      53126
10 Gnb4    GSM2545340 Cerebellum       1355
# ℹ 14,730 more rows
这很方便,但如果嵌套的函数过多,可能会难以阅读,因为 R 是从内向外求值表达式的(在本例中,先过滤,再选择)。
最后一种选项——管道,是 R 最近新增的功能。管道允许你将一个函数的输出直接传递给下一个函数,这在需要对同一数据集执行多项操作时非常有用。
R 中的管道看起来像 %>%(通过
magrittr 包提供)或
|>(通过 base R 提供)。如果您使用 RStudio,在 PC
上可以输入 Ctrl + Shift + M
来表示管道,在 Mac 上则可以输入 Cmd + Shift +
M。
在上述代码中,我们使用管道将 rna 数据集首先通过
filter() 过滤出 sex 为 Male 的行,然后通过
select() 仅保留
gene、sample、tissue 和
expression 列。
管道 |>
将左侧的对象直接作为右侧函数的第一个参数传递,我们不再需要显式地将数据框作为
filter() 和 select() 函数的参数包含在内。
R
rna |>
  filter(sex == "Male") |>
  select(gene, sample, tissue, expression)
输出
# A tibble: 14,740 × 4
   gene    sample     tissue     expression
   <chr>   <chr>      <chr>           <dbl>
 1 Asl     GSM2545340 Cerebellum        626
 2 Apod    GSM2545340 Cerebellum      13021
 3 Cyp2d22 GSM2545340 Cerebellum       2171
 4 Klk6    GSM2545340 Cerebellum        448
 5 Fcrls   GSM2545340 Cerebellum        180
 6 Slc2a4  GSM2545340 Cerebellum        313
 7 Exd2    GSM2545340 Cerebellum       2366
 8 Gjc2    GSM2545340 Cerebellum        310
 9 Plp1    GSM2545340 Cerebellum      53126
10 Gnb4    GSM2545340 Cerebellum       1355
# ℹ 14,730 more rows
有些人可能会觉得将 pipe
读作“然后”这个词很有帮助。例如,在上述示例中,我们取了数据框
rna,然后 对具有 sex == "Male"
的行进行了 filter,然后 对列
gene、sample、tissue 和
expression 进行了 select。
dplyr
函数本身较为简单,但通过使用管道将它们组合成线性工作流,我们可以对数据框进行更复杂的操作。
如果我们想用这个缩减版的数据创建一个新对象,可以为其指定一个新名称:
R
rna3 <- rna |>
  filter(sex == "Male") |>
  select(gene, sample, tissue, expression)

rna3
输出
# A tibble: 14,740 × 4
   gene    sample     tissue     expression
   <chr>   <chr>      <chr>           <dbl>
 1 Asl     GSM2545340 Cerebellum        626
 2 Apod    GSM2545340 Cerebellum      13021
 3 Cyp2d22 GSM2545340 Cerebellum       2171
 4 Klk6    GSM2545340 Cerebellum        448
 5 Fcrls   GSM2545340 Cerebellum        180
 6 Slc2a4  GSM2545340 Cerebellum        313
 7 Exd2    GSM2545340 Cerebellum       2366
 8 Gjc2    GSM2545340 Cerebellum        310
 9 Plp1    GSM2545340 Cerebellum      53126
10 Gnb4    GSM2545340 Cerebellum       1355
# ℹ 14,730 more rows挑战:
使用管道对 rna 数据进行子集提取,保留时间 0
时雌性小鼠且该基因表达值高于 50000 的观测值,并仅保留列
gene、sample、time、expression
和 age。
R
rna |>
  filter(expression > 50000,
         sex == "Female",
         time == 0 ) |>
  select(gene, sample, time, expression, age)
输出
# A tibble: 9 × 5
  gene   sample      time expression   age
  <chr>  <chr>      <dbl>      <dbl> <dbl>
1 Plp1   GSM2545337     0     101241     8
2 Atp1b1 GSM2545337     0      53260     8
3 Plp1   GSM2545338     0      96534     8
4 Atp1b1 GSM2545338     0      50614     8
5 Plp1   GSM2545348     0     102790     8
6 Atp1b1 GSM2545348     0      59544     8
7 Plp1   GSM2545353     0      71237     8
8 Glul   GSM2545353     0      52451     8
9 Atp1b1 GSM2545353     0      61451     8
创建和修改列(mutate)
你经常需要根据现有列的值创建新列,例如进行单位转换,或计算两个列中值的比值。为此,我们将使用
mutate()。
若要创建一个以小时为单位的时间新列:
R
rna |>
  mutate(time_hours = time * 24) |>
  select(time, time_hours)
输出
# A tibble: 32,428 × 2
    time time_hours
   <dbl>      <dbl>
 1     8        192
 2     8        192
 3     8        192
 4     8        192
 5     8        192
 6     8        192
 7     8        192
 8     8        192
 9     8        192
10     8        192
# ℹ 32,418 more rows
您还可以在同一次 mutate()
调用中,基于第一个新列创建第二个新列:
R
rna |>
  mutate(time_hours = time * 24,
         time_mn = time_hours * 60) |>
  select(time, time_hours, time_mn)
输出
# A tibble: 32,428 × 3
    time time_hours time_mn
   <dbl>      <dbl>   <dbl>
 1     8        192   11520
 2     8        192   11520
 3     8        192   11520
 4     8        192   11520
 5     8        192   11520
 6     8        192   11520
 7     8        192   11520
 8     8        192   11520
 9     8        192   11520
10     8        192   11520
# ℹ 32,418 more rows挑战
从 rna 数据中创建一个符合以下条件的新数据框:仅包含
gene、chromosome_name、phenotype_description、sample
和 expression
列。表达量值应进行自然对数变换。该数据框必须仅包含位于性染色体上、与
phenotype_description 相关且自然对数表达量大于 5 的基因。
提示:思考一下应该如何排列命令才能生成这个数据框!
R
rna |>
  mutate(expression = log(expression)) |>
  select(gene, chromosome_name, phenotype_description, sample, expression) |>
  filter(chromosome_name == "X" | chromosome_name == "Y") |>
  filter(!is.na(phenotype_description)) |>
  filter(expression > 5)
输出
# A tibble: 649 × 5
   gene   chromosome_name phenotype_description                sample expression
   <chr>  <chr>           <chr>                                <chr>       <dbl>
 1 Plp1   X               abnormal CNS glial cell morphology   GSM25…      10.7
 2 Slc7a3 X               decreased body length                GSM25…       5.46
 3 Plxnb3 X               abnormal coat appearance             GSM25…       6.58
 4 Rbm3   X               abnormal liver morphology            GSM25…       9.32
 5 Cfp    X               abnormal cardiovascular system phys… GSM25…       6.18
 6 Ebp    X               abnormal embryonic erythrocyte morp… GSM25…       6.68
 7 Cd99l2 X               abnormal cellular extravasation      GSM25…       8.04
 8 Piga   X               abnormal brain development           GSM25…       6.06
 9 Pim2   X               decreased T cell proliferation       GSM25…       7.11
10 Itm2a  X               no abnormal phenotype detected       GSM25…       7.48
# ℹ 639 more rows
分-应用-合并数据分析
许多数据分析任务可以采用 split-apply-combine
范式:将数据分组,对每组进行某种分析,然后将结果合并。dplyr
通过使用 group_by() 函数,使这一过程变得非常简单。
R
rna |>
  group_by(gene)
输出
# A tibble: 32,428 × 19
# Groups:   gene [1,474]
   gene    sample  expression organism   age sex   infection strain  time tissue
   <chr>   <chr>        <dbl> <chr>    <dbl> <chr> <chr>     <chr>  <dbl> <chr>
 1 Asl     GSM254…       1170 Mus mus…     8 Fema… Influenz… C57BL…     8 Cereb…
 2 Apod    GSM254…      36194 Mus mus…     8 Fema… Influenz… C57BL…     8 Cereb…
 3 Cyp2d22 GSM254…       4060 Mus mus…     8 Fema… Influenz… C57BL…     8 Cereb…
 4 Klk6    GSM254…        287 Mus mus…     8 Fema… Influenz… C57BL…     8 Cereb…
 5 Fcrls   GSM254…         85 Mus mus…     8 Fema… Influenz… C57BL…     8 Cereb…
 6 Slc2a4  GSM254…        782 Mus mus…     8 Fema… Influenz… C57BL…     8 Cereb…
 7 Exd2    GSM254…       1619 Mus mus…     8 Fema… Influenz… C57BL…     8 Cereb…
 8 Gjc2    GSM254…        288 Mus mus…     8 Fema… Influenz… C57BL…     8 Cereb…
 9 Plp1    GSM254…      43217 Mus mus…     8 Fema… Influenz… C57BL…     8 Cereb…
10 Gnb4    GSM254…       1071 Mus mus…     8 Fema… Influenz… C57BL…     8 Cereb…
# ℹ 32,418 more rows
# ℹ 9 more variables: mouse <dbl>, ENTREZID <dbl>, product <chr>,
#   ensembl_gene_id <chr>, external_synonym <chr>, chromosome_name <chr>,
#   gene_biotype <chr>, phenotype_description <chr>,
#   hsapiens_homolog_associated_gene_name <chr>
group_by()
函数不进行任何数据处理,而是将数据分组:在上述示例中,我们最初的包含
32428 观测值的 tibble 根据 gene 变量被分为
1474 个组。
我们同样可以决定按样本对该 tibble 进行分组:
R
rna |>
  group_by(sample)
输出
# A tibble: 32,428 × 19
# Groups:   sample [22]
   gene    sample  expression organism   age sex   infection strain  time tissue
   <chr>   <chr>        <dbl> <chr>    <dbl> <chr> <chr>     <chr>  <dbl> <chr>
 1 Asl     GSM254…       1170 Mus mus…     8 Fema… Influenz… C57BL…     8 Cereb…
 2 Apod    GSM254…      36194 Mus mus…     8 Fema… Influenz… C57BL…     8 Cereb…
 3 Cyp2d22 GSM254…       4060 Mus mus…     8 Fema… Influenz… C57BL…     8 Cereb…
 4 Klk6    GSM254…        287 Mus mus…     8 Fema… Influenz… C57BL…     8 Cereb…
 5 Fcrls   GSM254…         85 Mus mus…     8 Fema… Influenz… C57BL…     8 Cereb…
 6 Slc2a4  GSM254…        782 Mus mus…     8 Fema… Influenz… C57BL…     8 Cereb…
 7 Exd2    GSM254…       1619 Mus mus…     8 Fema… Influenz… C57BL…     8 Cereb…
 8 Gjc2    GSM254…        288 Mus mus…     8 Fema… Influenz… C57BL…     8 Cereb…
 9 Plp1    GSM254…      43217 Mus mus…     8 Fema… Influenz… C57BL…     8 Cereb…
10 Gnb4    GSM254…       1071 Mus mus…     8 Fema… Influenz… C57BL…     8 Cereb…
# ℹ 32,418 more rows
# ℹ 9 more variables: mouse <dbl>, ENTREZID <dbl>, product <chr>,
#   ensembl_gene_id <chr>, external_synonym <chr>, chromosome_name <chr>,
#   gene_biotype <chr>, phenotype_description <chr>,
#   hsapiens_homolog_associated_gene_name <chr>
这里,我们最初的 tibble 包含 32428 个观测值,并根据
sample 变量分为 22 个组。
数据分组后,后续操作将独立地应用于每个组。
summarise() 函数
group_by() 通常与 summarise()
配合使用,将每个组合并为该组的单行汇总。
group_by()
接收作为参数的列名,这些列名包含您想要计算汇总统计量的分类变量。因此,若要计算基因的
expression 平均值:
R
rna |>
  group_by(gene) |>
  summarise(mean_expression = mean(expression))
输出
# A tibble: 1,474 × 2
   gene     mean_expression
   <chr>              <dbl>
 1 AI504432         1053.
 2 AW046200          131.
 3 AW551984          295.
 4 Aamp             4751.
 5 Abca12              4.55
 6 Abcc8            2498.
 7 Abhd14a           525.
 8 Abi2             4909.
 9 Abi3bp           1002.
10 Abl2             2124.
# ℹ 1,464 more rows
我们还可能想计算每个样本中所有基因的平均表达水平:
R
rna |>
  group_by(sample) |>
  summarise(mean_expression = mean(expression))
输出
# A tibble: 22 × 2
   sample     mean_expression
   <chr>                <dbl>
 1 GSM2545336           2062.
 2 GSM2545337           1766.
 3 GSM2545338           1668.
 4 GSM2545339           1696.
 5 GSM2545340           1682.
 6 GSM2545341           1638.
 7 GSM2545342           1594.
 8 GSM2545343           2107.
 9 GSM2545344           1712.
10 GSM2545345           1700.
# ℹ 12 more rows
但我们也可以按多个列进行分组:
R
rna |>
  group_by(gene, infection, time) |>
  summarise(mean_expression = mean(expression))
输出
`summarise()` has regrouped the output.
ℹ Summaries were computed grouped by gene, infection, and time.
ℹ Output is grouped by gene and infection.
ℹ Use `summarise(.groups = "drop_last")` to silence this message.
ℹ Use `summarise(.by = c(gene, infection, time))` for per-operation grouping
  (`?dplyr::dplyr_by`) instead.
输出
# A tibble: 4,422 × 4
# Groups:   gene, infection [2,948]
   gene     infection    time mean_expression
   <chr>    <chr>       <dbl>           <dbl>
 1 AI504432 InfluenzaA      4           1104.
 2 AI504432 InfluenzaA      8           1014
 3 AI504432 NonInfected     0           1034.
 4 AW046200 InfluenzaA      4            152.
 5 AW046200 InfluenzaA      8             81
 6 AW046200 NonInfected     0            155.
 7 AW551984 InfluenzaA      4            302.
 8 AW551984 InfluenzaA      8            342.
 9 AW551984 NonInfected     0            238
10 Aamp     InfluenzaA      4           4870
# ℹ 4,412 more rows
数据分组后,您还可以同时汇总多个变量(且不一定必须在同一个变量上)。例如,我们可以添加一列,分别显示按基因和条件划分的
expression 中位数:
R
rna |>
  group_by(gene, infection, time) |>
  summarise(mean_expression = mean(expression),
            median_expression = median(expression))
输出
`summarise()` has regrouped the output.
ℹ Summaries were computed grouped by gene, infection, and time.
ℹ Output is grouped by gene and infection.
ℹ Use `summarise(.groups = "drop_last")` to silence this message.
ℹ Use `summarise(.by = c(gene, infection, time))` for per-operation grouping
  (`?dplyr::dplyr_by`) instead.
输出
# A tibble: 4,422 × 5
# Groups:   gene, infection [2,948]
   gene     infection    time mean_expression median_expression
   <chr>    <chr>       <dbl>           <dbl>             <dbl>
 1 AI504432 InfluenzaA      4           1104.             1094.
 2 AI504432 InfluenzaA      8           1014               985
 3 AI504432 NonInfected     0           1034.             1016
 4 AW046200 InfluenzaA      4            152.              144.
 5 AW046200 InfluenzaA      8             81                82
 6 AW046200 NonInfected     0            155.              163
 7 AW551984 InfluenzaA      4            302.              245
 8 AW551984 InfluenzaA      8            342.              287
 9 AW551984 NonInfected     0            238               265
10 Aamp     InfluenzaA      4           4870              4708
# ℹ 4,412 more rows挑战
计算基因“Dok3”在不同时间点的平均表达水平。
R
rna |>
  filter(gene == "Dok3") |>
  group_by(time) |>
  summarise(mean = mean(expression))
输出
# A tibble: 3 × 2
   time  mean
  <dbl> <dbl>
1     0  169
2     4  156.
3     8   61
计数
在处理数据时,我们通常想知道每个因子或因子组合所对应的观测值数量。针对这一任务,dplyr
提供了
count()。例如,如果我们想分别统计感染组和未感染组的数据行数,可以这样写:
R
rna |>
    count(infection)
输出
# A tibble: 2 × 2
  infection       n
  <chr>       <int>
1 InfluenzaA  22110
2 NonInfected 10318
count()
函数是对我们之前见过的操作的简写:按变量进行分组,并通过统计该组中观测值的数量来进行汇总。换句话说,rna |> count(infection)
等同于:
R
rna |>
    group_by(infection) |>
    summarise(n = n())
输出
# A tibble: 2 × 2
  infection       n
  <chr>       <int>
1 InfluenzaA  22110
2 NonInfected 10318
前面的示例展示了如何使用 count()
来统计单一因子(即
infection)的行数/观测值。如果我们想统计因子的组合,例如
infection 和
time,我们将指定第一个和第二个因子作为 count()
的参数:
R
rna |>
    count(infection, time)
输出
# A tibble: 3 × 3
  infection    time     n
  <chr>       <dbl> <int>
1 InfluenzaA      4 11792
2 InfluenzaA      8 10318
3 NonInfected     0 10318
这等同于以下内容:
R
rna |>
  group_by(infection, time) |>
  summarise(n = n())
输出
`summarise()` has regrouped the output.
ℹ Summaries were computed grouped by infection and time.
ℹ Output is grouped by infection.
ℹ Use `summarise(.groups = "drop_last")` to silence this message.
ℹ Use `summarise(.by = c(infection, time))` for per-operation grouping
  (`?dplyr::dplyr_by`) instead.
输出
# A tibble: 3 × 3
# Groups:   infection [2]
  infection    time     n
  <chr>       <dbl> <int>
1 InfluenzaA      4 11792
2 InfluenzaA      8 10318
3 NonInfected     0 10318
有时对结果进行排序会有所帮助,以便于比较。我们可以使用
arrange()
来对表格进行排序。例如,我们可能想按时间对上述表格进行排序:
R
rna |>
  count(infection, time) |>
  arrange(time)
输出
# A tibble: 3 × 3
  infection    time     n
  <chr>       <dbl> <int>
1 NonInfected     0 10318
2 InfluenzaA      4 11792
3 InfluenzaA      8 10318
或按计数:
R
rna |>
  count(infection, time) |>
  arrange(n)
输出
# A tibble: 3 × 3
  infection    time     n
  <chr>       <dbl> <int>
1 InfluenzaA      8 10318
2 NonInfected     0 10318
3 InfluenzaA      4 11792
若要按降序排序,我们需要添加 desc() 函数:
R
rna |>
  count(infection, time) |>
  arrange(desc(n))
输出
# A tibble: 3 × 3
  infection    time     n
  <chr>       <dbl> <int>
1 InfluenzaA      4 11792
2 InfluenzaA      8 10318
3 NonInfected 0 10318挑战
- 每个样本中分析了多少个基因?
- 使用
group_by()和summarise()评估每个样本的测序深度(所有计数之和)。哪个样本的测序深度最高? - 选择一个样本,并按生物类型统计基因数量。
- 识别与“abnormal DNA methylation”表型描述相关的基因,并计算它们在时间 0、时间 4 和时间 8 时的平均表达量(以 log 为单位)。
R
## 1.
rna |>
  count(sample)
输出
# A tibble: 22 × 2
   sample         n
   <chr>      <int>
 1 GSM2545336  1474
 2 GSM2545337  1474
 3 GSM2545338  1474
 4 GSM2545339  1474
 5 GSM2545340  1474
 6 GSM2545341  1474
 7 GSM2545342  1474
 8 GSM2545343  1474
 9 GSM2545344  1474
10 GSM2545345  1474
# ℹ 12 more rows
R
## 2.
rna |>
  group_by(sample) |>
  summarise(seq_depth = sum(expression)) |>
  arrange(desc(seq_depth))
输出
# A tibble: 22 × 2
   sample     seq_depth
   <chr>          <dbl>
 1 GSM2545350   3255566
 2 GSM2545352   3216163
 3 GSM2545343   3105652
 4 GSM2545336   3039671
 5 GSM2545380   3036098
 6 GSM2545353   2953249
 7 GSM2545348   2913678
 8 GSM2545362   2913517
 9 GSM2545351   2782464
10 GSM2545349   2758006
# ℹ 12 more rows
R
## 3.
rna |>
  filter(sample == "GSM2545336") |>
  count(gene_biotype) |>
  arrange(desc(n))
输出
# A tibble: 13 × 2
   gene_biotype                           n
   <chr>                              <int>
 1 protein_coding                      1321
 2 lncRNA                                69
 3 processed_pseudogene                  59
 4 miRNA                                  7
 5 snoRNA                                 5
 6 TEC                                    4
 7 polymorphic_pseudogene                 2
 8 unprocessed_pseudogene                 2
 9 IG_C_gene                              1
10 scaRNA                                 1
11 transcribed_processed_pseudogene       1
12 transcribed_unitary_pseudogene         1
13 transcribed_unprocessed_pseudogene     1
R
## 4.
rna |>
  filter(phenotype_description == "abnormal DNA methylation") |>
  group_by(gene, time) |>
  summarise(mean_expression = mean(log(expression))) |>
  arrange()
输出
`summarise()` has regrouped the output.
ℹ Summaries were computed grouped by gene and time.
ℹ Output is grouped by gene.
ℹ Use `summarise(.groups = "drop_last")` to silence this message.
ℹ Use `summarise(.by = c(gene, time))` for per-operation grouping
  (`?dplyr::dplyr_by`) instead.
输出
# A tibble: 6 × 3
# Groups:   gene [2]
  gene   time mean_expression
  <chr> <dbl>           <dbl>
1 Xist      0            6.95
2 Xist      4            6.34
3 Xist      8            7.13
4 Zdbf2     0            6.27
5 Zdbf2     4            6.27
6 Zdbf2     8            6.19
数据重塑
在 rna tibble
中,行包含表达值(单位),这些值与另外两个变量 gene 和
sample 组合相关联。
所有其他列都对应于描述样本(生物体、年龄、性别……)或基因(gene_biotype、ENTREZ_ID、产物……)的变量。那些不随基因或样本而变化的变量在所有行中都具有相同的值。
R
rna |>
  arrange(gene)
输出
# A tibble: 32,428 × 19
   gene     sample expression organism   age sex   infection strain  time tissue
   <chr>    <chr>       <dbl> <chr>    <dbl> <chr> <chr>     <chr>  <dbl> <chr>
 1 AI504432 GSM25…       1230 Mus mus…     8 Fema… Influenz… C57BL…     8 Cereb…
 2 AI504432 GSM25…       1085 Mus mus…     8 Fema… NonInfec… C57BL…     0 Cereb…
 3 AI504432 GSM25…        969 Mus mus…     8 Fema… NonInfec… C57BL…     0 Cereb…
 4 AI504432 GSM25…       1284 Mus mus…     8 Fema… Influenz… C57BL…     4 Cereb…
 5 AI504432 GSM25…        966 Mus mus…     8 Male  Influenz… C57BL…     4 Cereb…
 6 AI504432 GSM25…        918 Mus mus…     8 Male  Influenz… C57BL…     8 Cereb…
 7 AI504432 GSM25…        985 Mus mus…     8 Fema… Influenz… C57BL…     8 Cereb…
 8 AI504432 GSM25…        972 Mus mus…     8 Male  NonInfec… C57BL…     0 Cereb…
 9 AI504432 GSM25…       1000 Mus mus…     8 Fema… Influenz… C57BL…     4 Cereb…
10 AI504432 GSM25…        816 Mus mus…     8 Male  Influenz… C57BL…     4 Cereb…
# ℹ 32,418 more rows
# ℹ 9 more variables: mouse <dbl>, ENTREZID <dbl>, product <chr>,
#   ensembl_gene_id <chr>, external_synonym <chr>, chromosome_name <chr>,
#   gene_biotype <chr>, phenotype_description <chr>,
#   hsapiens_homolog_associated_gene_name <chr>
这种结构被称为
long-format,因为其中一列包含所有值,而其他列则列出该值的上下文。
在某些情况下,long-format
并不真正“易于阅读”,因此更倾向于使用另一种格式——wide-format,以便以更紧凑的方式表示数据。这种情况通常发生在基因表达值上,科学家习惯于将其视为矩阵,其中行代表基因,列代表样本。
因此,在这种格式下,探索样本内部以及样本之间的基因表达水平的关系将变得十分简单。
输出
# A tibble: 1,474 × 23
   gene    GSM2545336 GSM2545337 GSM2545338 GSM2545339 GSM2545340 GSM2545341
   <chr>        <dbl>      <dbl>      <dbl>      <dbl>      <dbl>      <dbl>
 1 Asl           1170        361        400        586        626        988
 2 Apod         36194      10347       9173      10620      13021      29594
 3 Cyp2d22       4060       1616       1603       1901       2171       3349
 4 Klk6           287        629        641        578        448        195
 5 Fcrls           85        233        244        237        180         38
 6 Slc2a4         782        231        248        265        313        786
 7 Exd2          1619       2288       2235       2513       2366       1359
 8 Gjc2           288        595        568        551        310        146
 9 Plp1         43217     101241      96534      58354      53126      27173
10 Gnb4          1071       1791       1867       1430       1355        798
# ℹ 1,464 more rows
# ℹ 16 more variables: GSM2545342 <dbl>, GSM2545343 <dbl>, GSM2545344 <dbl>,
#   GSM2545345 <dbl>, GSM2545346 <dbl>, GSM2545347 <dbl>, GSM2545348 <dbl>,
#   GSM2545349 <dbl>, GSM2545350 <dbl>, GSM2545351 <dbl>, GSM2545352 <dbl>,
#   GSM2545353 <dbl>, GSM2545354 <dbl>, GSM2545362 <dbl>, GSM2545363 <dbl>,
#   GSM2545380 <dbl>
若要将基因表达值从 rna
转换为宽格式,我们需要创建一个新表,其中 sample
列的值将成为列变量的名称。
这里的关键点在于,我们依然遵循整洁数据结构,但根据感兴趣的观测项对数据进行了重塑:采用每个基因的表达水平,而非按基因和样本分别记录。
相反的转换则是将列名转换为新变量的值。
我们可以使用两个 tidyr 函数 pivot_longer()
和 pivot_wider() 来完成这两种转换(详情请参阅 tidyr
网站上的关于 pivot 的文章)。
将数据转换为宽格式
让我们选择 rna 的前 3 列,并使用
pivot_wider() 将数据转换为宽格式。
R
rna_exp <- rna |>
  select(gene, sample, expression)
rna_exp
输出
# A tibble: 32,428 × 3
   gene    sample     expression
   <chr>   <chr>           <dbl>
 1 Asl     GSM2545336       1170
 2 Apod    GSM2545336      36194
 3 Cyp2d22 GSM2545336       4060
 4 Klk6    GSM2545336        287
 5 Fcrls   GSM2545336         85
 6 Slc2a4  GSM2545336        782
 7 Exd2    GSM2545336       1619
 8 Gjc2    GSM2545336        288
 9 Plp1    GSM2545336      43217
10 Gnb4    GSM2545336       1071
# ℹ 32,418 more rows
pivot_wider 接收三个主要参数:
- 待转换的数据;
-
names_from: 其值将成为新列名的列; -
values_from:其值将填充新列的列。
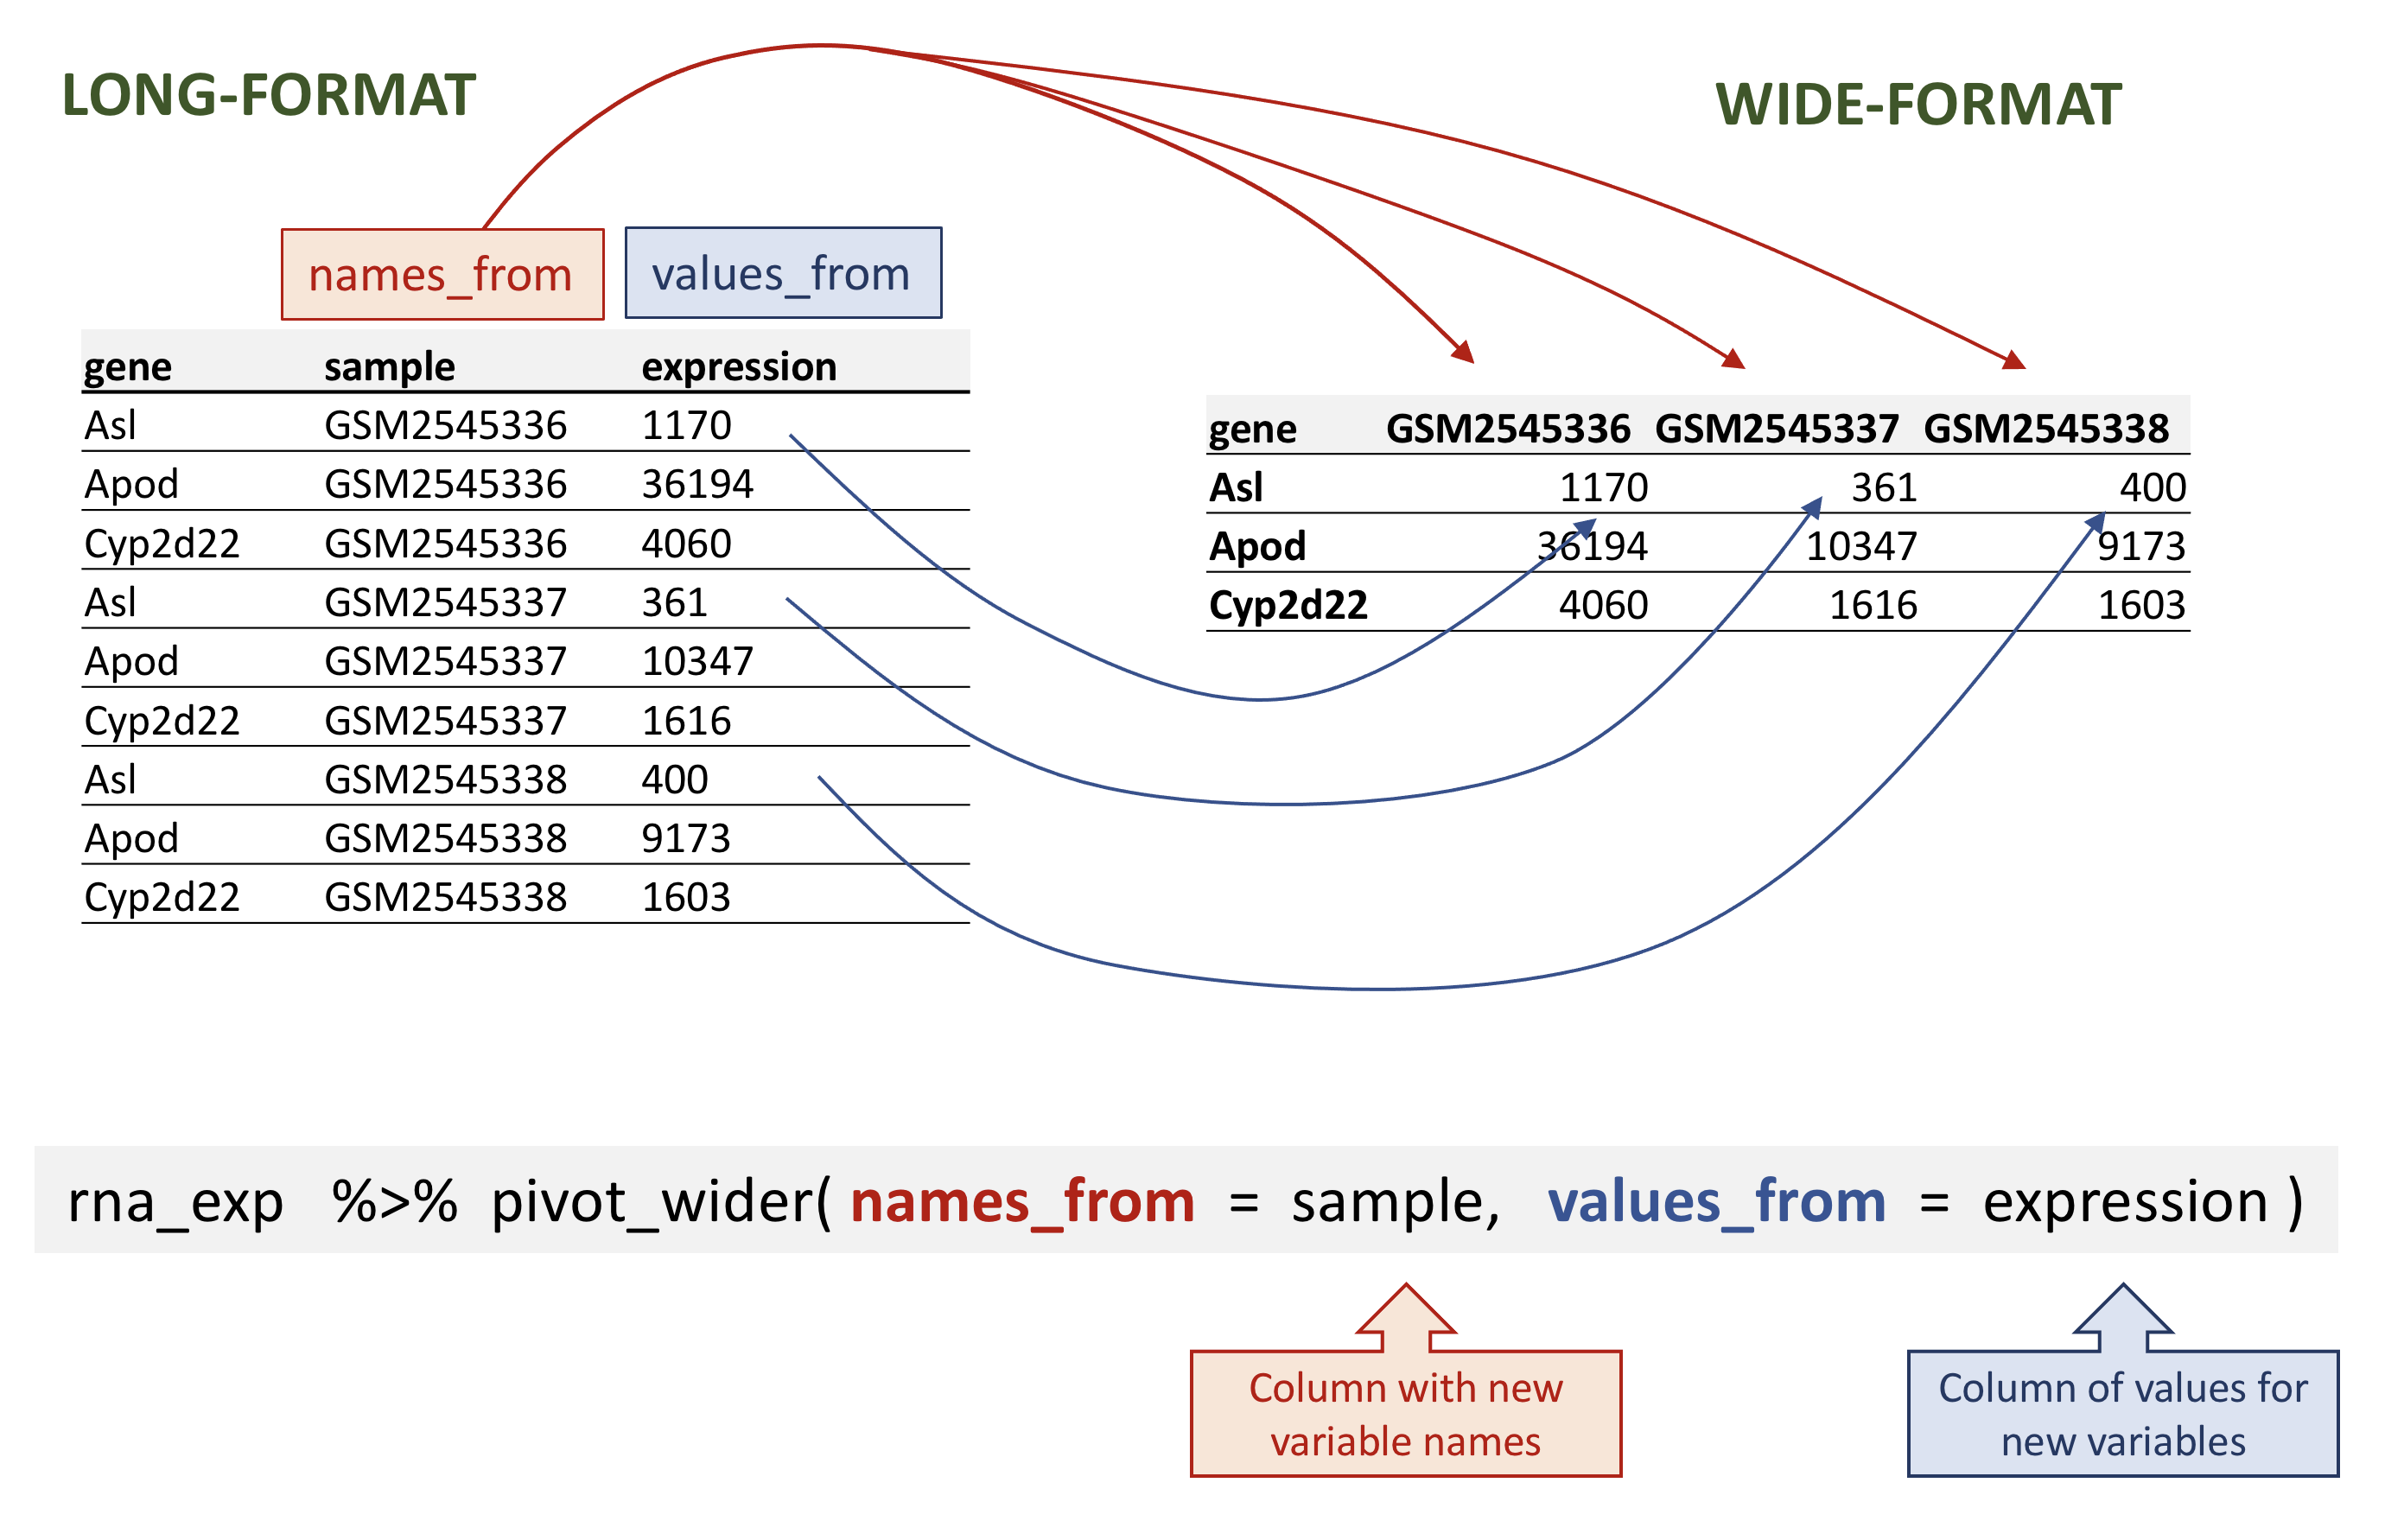
rna data.
R
rna_wide <- rna_exp |>
  pivot_wider(names_from = sample,
              values_from = expression)
rna_wide
输出
# A tibble: 1,474 × 23
   gene    GSM2545336 GSM2545337 GSM2545338 GSM2545339 GSM2545340 GSM2545341
   <chr>        <dbl>      <dbl>      <dbl>      <dbl>      <dbl>      <dbl>
 1 Asl           1170        361        400        586        626        988
 2 Apod         36194      10347       9173      10620      13021      29594
 3 Cyp2d22       4060       1616       1603       1901       2171       3349
 4 Klk6           287        629        641        578        448        195
 5 Fcrls           85        233        244        237        180         38
 6 Slc2a4         782        231        248        265        313        786
 7 Exd2          1619       2288       2235       2513       2366       1359
 8 Gjc2           288        595        568        551        310        146
 9 Plp1         43217     101241      96534      58354      53126      27173
10 Gnb4          1071       1791       1867       1430       1355        798
# ℹ 1,464 more rows
# ℹ 16 more variables: GSM2545342 <dbl>, GSM2545343 <dbl>, GSM2545344 <dbl>,
#   GSM2545345 <dbl>, GSM2545346 <dbl>, GSM2545347 <dbl>, GSM2545348 <dbl>,
#   GSM2545349 <dbl>, GSM2545350 <dbl>, GSM2545351 <dbl>, GSM2545352 <dbl>,
#   GSM2545353 <dbl>, GSM2545354 <dbl>, GSM2545362 <dbl>, GSM2545363 <dbl>,
# GSM2545380 <dbl>请注意,默认情况下,pivot_wider() 函数会为缺失值添加
NA。
假设由于某种原因,在某些样本中,部分基因的表达值缺失。在以下虚构示例中,基因 Cyp2d22 仅保留一个表达值,来自 GSM2545338 样本。
R
rna_with_missing_values <- rna |>
  select(gene, sample, expression) |>
  filter(gene %in% c("Asl", "Apod", "Cyp2d22")) |>
  filter(sample %in% c("GSM2545336", "GSM2545337", "GSM2545338")) |>
  arrange(sample) |>
  filter(!(gene == "Cyp2d22" & sample != "GSM2545338"))
rna_with_missing_values
输出
# A tibble: 7 × 3
  gene    sample     expression
  <chr>   <chr>           <dbl>
1 Asl     GSM2545336       1170
2 Apod    GSM2545336      36194
3 Asl     GSM2545337        361
4 Apod    GSM2545337      10347
5 Asl     GSM2545338        400
6 Apod    GSM2545338       9173
7 Cyp2d22 GSM2545338 1603默认情况下,pivot_wider() 函数会为缺失值添加
NA。这可以通过 pivot_wider() 函数的
values_fill 参数进行参数化。
R
rna_with_missing_values |>
  pivot_wider(names_from = sample,
              values_from = expression)
输出
# A tibble: 3 × 4
  gene    GSM2545336 GSM2545337 GSM2545338
  <chr>        <dbl>      <dbl>      <dbl>
1 Asl           1170        361        400
2 Apod         36194      10347       9173
3 Cyp2d22         NA         NA       1603
R
rna_with_missing_values |>
  pivot_wider(names_from = sample,
              values_from = expression,
              values_fill = 0)
输出
# A tibble: 3 × 4
  gene    GSM2545336 GSM2545337 GSM2545338
  <chr>        <dbl>      <dbl>      <dbl>
1 Asl           1170        361        400
2 Apod         36194      10347       9173
3 Cyp2d22          0          0       1603
将数据转换为长格式
在另一种情况下,我们使用列名并将其转换为一对新变量。其中一个变量将列名作为值表示,另一个变量则包含此前与列名关联的值。
pivot_longer() 接收四个主要参数:
- 待转换的数据;
-
names_to:我们想要创建并填充当前列名的新列名; -
values_to:我们想要创建并填充当前值的新列名; - 用于填充
names_to和values_to变量的列名(或用于删除的列名)。
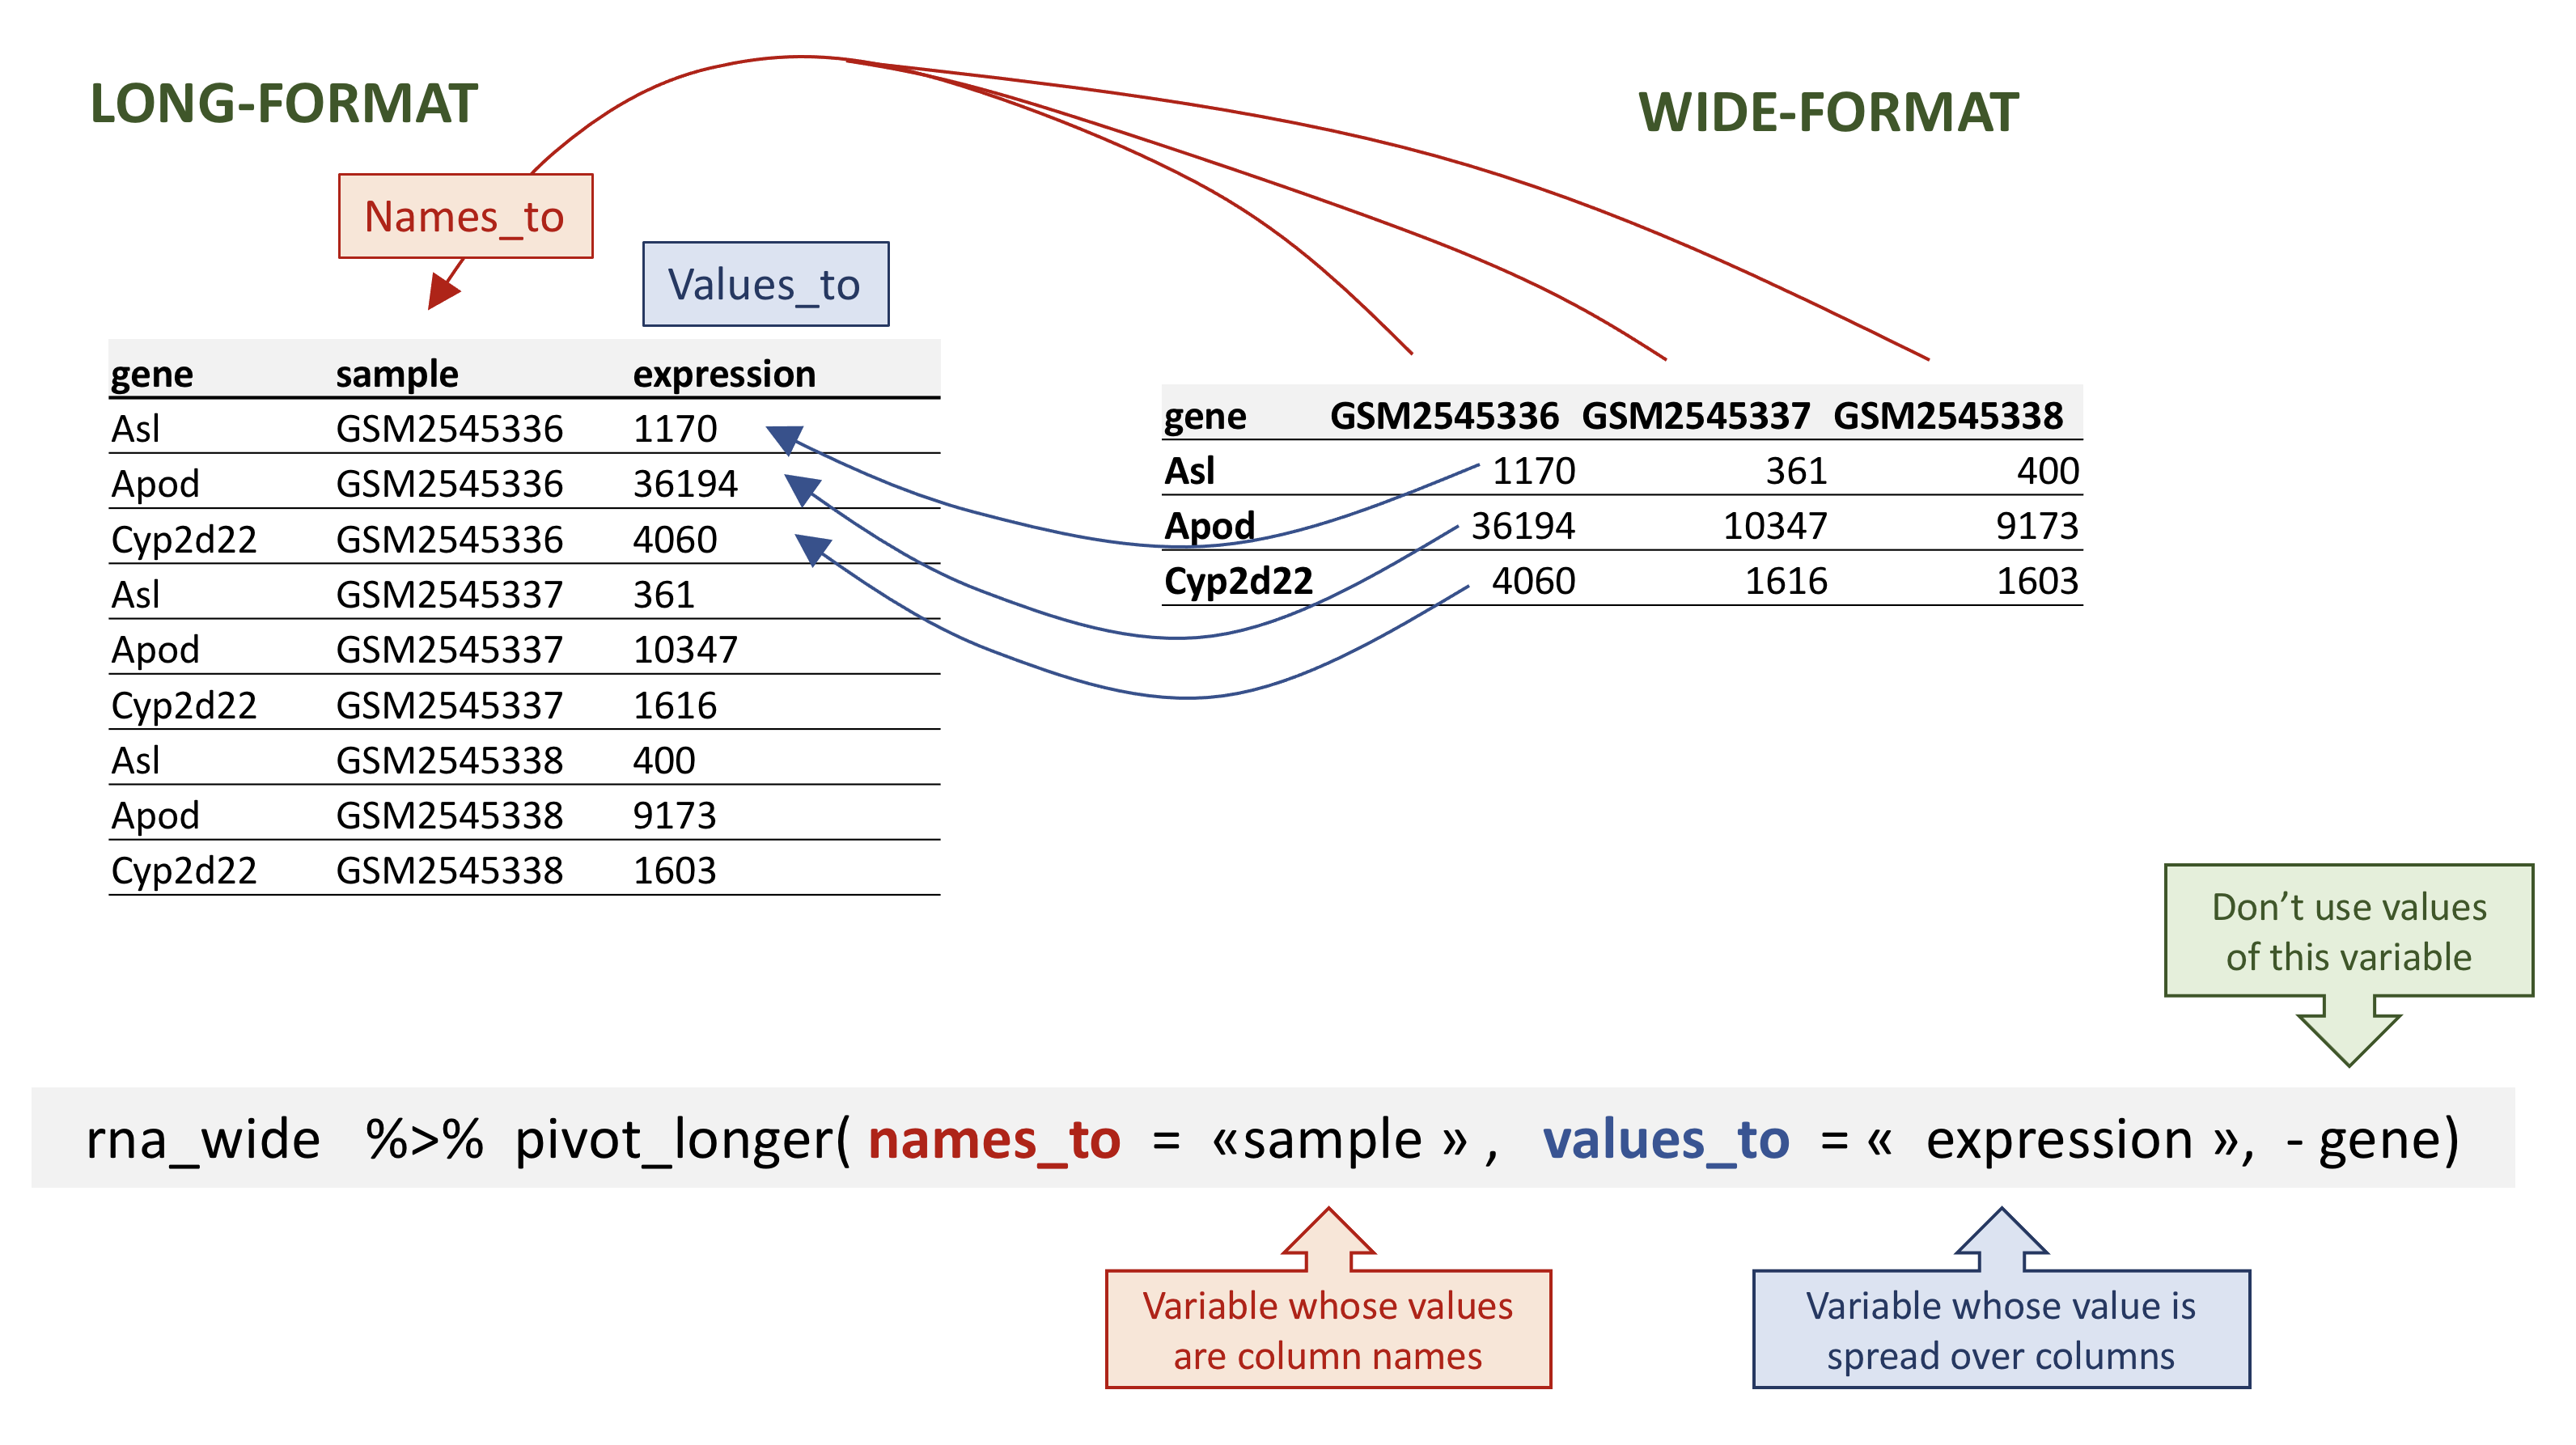
rna data.
若要从 rna_wide 还原出
rna_long,我们将创建一个名为 sample
的键和一个名为 expression 的值,并使用除 gene
之外的所有列作为键变量。这里我们使用减号去掉 gene 列。
请注意,这里的新变量名需要加引号。
R
rna_long <- rna_wide |>
    pivot_longer(names_to = "sample",
                 values_to = "expression",
                 -gene)
rna_long
输出
# A tibble: 32,428 × 3
   gene  sample     expression
   <chr> <chr>           <dbl>
 1 Asl   GSM2545336       1170
 2 Asl   GSM2545337        361
 3 Asl   GSM2545338        400
 4 Asl   GSM2545339        586
 5 Asl   GSM2545340        626
 6 Asl   GSM2545341        988
 7 Asl   GSM2545342        836
 8 Asl   GSM2545343        535
 9 Asl   GSM2545344        586
10 Asl   GSM2545345        597
# ℹ 32,418 more rows我们也可以使用规范来指定要包含的列。如果你有大量标识列,这种方法会很有用,因为指定要收集的列比指定要保留的列更方便。在这里,starts_with()
函数可以帮助获取样本名称,而无需逐一列出!另一种方案是使用
: 运算符!
R
rna_wide |>
    pivot_longer(names_to = "sample",
                 values_to = "expression",
                 cols = starts_with("GSM"))
输出
# A tibble: 32,428 × 3
   gene  sample     expression
   <chr> <chr>           <dbl>
 1 Asl   GSM2545336       1170
 2 Asl   GSM2545337        361
 3 Asl   GSM2545338        400
 4 Asl   GSM2545339        586
 5 Asl   GSM2545340        626
 6 Asl   GSM2545341        988
 7 Asl   GSM2545342        836
 8 Asl   GSM2545343        535
 9 Asl   GSM2545344        586
10 Asl   GSM2545345        597
# ℹ 32,418 more rows
R
rna_wide |>
    pivot_longer(names_to = "sample",
                 values_to = "expression",
                 GSM2545336:GSM2545380)
输出
# A tibble: 32,428 × 3
   gene  sample     expression
   <chr> <chr>           <dbl>
 1 Asl   GSM2545336       1170
 2 Asl   GSM2545337        361
 3 Asl   GSM2545338        400
 4 Asl   GSM2545339        586
 5 Asl   GSM2545340        626
 6 Asl   GSM2545341        988
 7 Asl   GSM2545342        836
 8 Asl   GSM2545343        535
 9 Asl   GSM2545344        586
10 Asl   GSM2545345        597
# ℹ 32,418 more rows请注意,如果宽格式中包含缺失值,NA
将被包含在新的长格式中。
回顾我们之前那个包含缺失值的虚拟 tibble:
R
rna_with_missing_values
输出
# A tibble: 7 × 3
  gene    sample     expression
  <chr>   <chr>           <dbl>
1 Asl     GSM2545336       1170
2 Apod    GSM2545336      36194
3 Asl     GSM2545337        361
4 Apod    GSM2545337      10347
5 Asl     GSM2545338        400
6 Apod    GSM2545338       9173
7 Cyp2d22 GSM2545338       1603
R
wide_with_NA <- rna_with_missing_values |>
  pivot_wider(names_from = sample,
              values_from = expression)
wide_with_NA
输出
# A tibble: 3 × 4
  gene    GSM2545336 GSM2545337 GSM2545338
  <chr>        <dbl>      <dbl>      <dbl>
1 Asl           1170        361        400
2 Apod         36194      10347       9173
3 Cyp2d22         NA         NA       1603
R
wide_with_NA |>
    pivot_longer(names_to = "sample",
                 values_to = "expression",
                 -gene)
输出
# A tibble: 9 × 3
  gene    sample     expression
  <chr>   <chr>           <dbl>
1 Asl     GSM2545336       1170
2 Asl     GSM2545337        361
3 Asl     GSM2545338        400
4 Apod    GSM2545336      36194
5 Apod    GSM2545337      10347
6 Apod    GSM2545338       9173
7 Cyp2d22 GSM2545336         NA
8 Cyp2d22 GSM2545337         NA
9 Cyp2d22 GSM2545338       1603
转换为宽格式和长格式是一种有效的方法,可以平衡数据集,使每个重复实验的组成一致。
问题
从 rna 表开始,使用 pivot_wider()
函数创建一个宽格式表,显示每只小鼠的基因表达水平。然后使用
pivot_longer() 函数还原为长格式表。
R
rna1 <- rna |>
select(gene, mouse, expression) |>
pivot_wider(names_from = mouse, values_from = expression)
rna1
输出
# A tibble: 1,474 × 23
   gene     `14`    `9`  `10`  `15`  `18`   `6`   `5`  `11`  `22`  `13`  `23`
   <chr>   <dbl>  <dbl> <dbl> <dbl> <dbl> <dbl> <dbl> <dbl> <dbl> <dbl> <dbl>
 1 Asl      1170    361   400   586   626   988   836   535   586   597   938
 2 Apod    36194  10347  9173 10620 13021 29594 24959 13668 13230 15868 27769
 3 Cyp2d22  4060   1616  1603  1901  2171  3349  3122  2008  2254  2277  2985
 4 Klk6      287    629   641   578   448   195   186  1101   537   567   327
 5 Fcrls      85    233   244   237   180    38    68   375   199   177    89
 6 Slc2a4    782    231   248   265   313   786   528   249   266   357   654
 7 Exd2     1619   2288  2235  2513  2366  1359  1474  3126  2379  2173  1531
 8 Gjc2      288    595   568   551   310   146   186   791   454   370   240
 9 Plp1    43217 101241 96534 58354 53126 27173 28728 98658 61356 61647 38019
10 Gnb4     1071   1791  1867  1430  1355   798   806  2437  1394  1554   960
# ℹ 1,464 more rows
# ℹ 11 more variables: `24` <dbl>, `8` <dbl>, `7` <dbl>, `1` <dbl>, `16` <dbl>,
#   `21` <dbl>, `4` <dbl>, `2` <dbl>, `20` <dbl>, `12` <dbl>, `19` <dbl>
R
rna1 |>
pivot_longer(names_to = "mouse_id", values_to = "counts", -gene)
输出
# A tibble: 32,428 × 3
   gene  mouse_id counts
   <chr> <chr>     <dbl>
 1 Asl   14         1170
 2 Asl   9           361
 3 Asl   10          400
 4 Asl   15          586
 5 Asl   18          626
 6 Asl   6           988
 7 Asl   5           836
 8 Asl   11          535
 9 Asl   22          586
10 Asl   13          597
# ℹ 32,418 more rows问题
从 rna 数据框中提取位于 X 和 Y
染色体上的基因子集,并将该数据框展开,以 sex
为列,chromosome_name
为行,每条染色体上基因的平均表达量为值,如下所示的 tibble 所示:
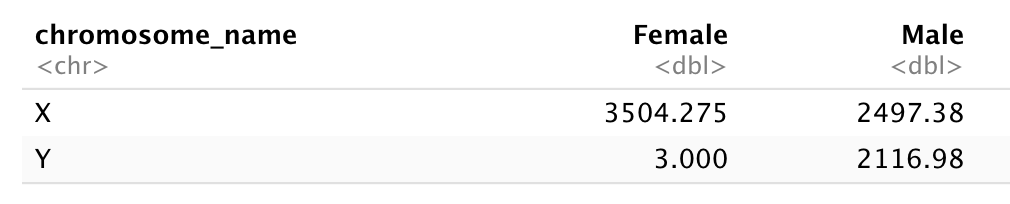
在重塑之前,您需要先进行汇总!
首先,让我们计算雄性和雌性样本中 X 和 Y 连锁基因的平均表达水平……
R
 rna |>
  filter(chromosome_name == "Y" | chromosome_name == "X") |>
  group_by(sex, chromosome_name) |>
  summarise(mean = mean(expression))
输出
`summarise()` has regrouped the output.
ℹ Summaries were computed grouped by sex and chromosome_name.
ℹ Output is grouped by sex.
ℹ Use `summarise(.groups = "drop_last")` to silence this message.
ℹ Use `summarise(.by = c(sex, chromosome_name))` for per-operation grouping
  (`?dplyr::dplyr_by`) instead.
输出
# A tibble: 4 × 3
# Groups:   sex [2]
  sex    chromosome_name  mean
  <chr>  <chr>           <dbl>
1 Female X               3504.
2 Female Y                  3
3 Male   X               2497.
4 Male   Y               2117.
并将表格转换为宽格式
R
rna_1 <- rna |>
  filter(chromosome_name == "Y" | chromosome_name == "X") |>
  group_by(sex, chromosome_name) |>
  summarise(mean = mean(expression)) |>
  pivot_wider(names_from = sex,
              values_from = mean)
输出
`summarise()` has regrouped the output.
ℹ Summaries were computed grouped by sex and chromosome_name.
ℹ Output is grouped by sex.
ℹ Use `summarise(.groups = "drop_last")` to silence this message.
ℹ Use `summarise(.by = c(sex, chromosome_name))` for per-operation grouping
  (`?dplyr::dplyr_by`) instead.
R
rna_1
输出
# A tibble: 2 × 3
  chromosome_name Female  Male
  <chr>            <dbl> <dbl>
1 X                3504. 2497.
2 Y                   3  2117.
现在将该数据框通过 pivot_longer()
进行转换,使每一行都成为一个唯一的 chromosome_name 与
gender 组合。
R
rna_1 |>
  pivot_longer(names_to = "gender",
               values_to = "mean",
               -chromosome_name)
输出
# A tibble: 4 × 3
  chromosome_name gender  mean
  <chr>           <chr>  <dbl>
1 X               Female 3504.
2 X               Male   2497.
3 Y               Female    3
4 Y Male 2117.问题
使用 rna
数据集创建一个表达矩阵,其中每行代表基因的平均表达水平,每列代表不同的时间点。
首先,让我们计算每个基因和每个时间点的平均表达量。
R
rna |>
  group_by(gene, time) |>
  summarise(mean_exp = mean(expression))
输出
`summarise()` has regrouped the output.
ℹ Summaries were computed grouped by gene and time.
ℹ Output is grouped by gene.
ℹ Use `summarise(.groups = "drop_last")` to silence this message.
ℹ Use `summarise(.by = c(gene, time))` for per-operation grouping
  (`?dplyr::dplyr_by`) instead.
输出
# A tibble: 4,422 × 3
# Groups:   gene [1,474]
   gene      time mean_exp
   <chr>    <dbl>    <dbl>
 1 AI504432     0    1034.
 2 AI504432     4    1104.
 3 AI504432     8    1014
 4 AW046200     0     155.
 5 AW046200     4     152.
 6 AW046200     8      81
 7 AW551984     0     238
 8 AW551984     4     302.
 9 AW551984     8     342.
10 Aamp         0    4603.
# ℹ 4,412 more rows
在使用 pivot_wider() 函数之前
R
rna_time <- rna |>
  group_by(gene, time) |>
  summarise(mean_exp = mean(expression)) |>
  pivot_wider(names_from = time,
              values_from = mean_exp)
输出
`summarise()` has regrouped the output.
ℹ Summaries were computed grouped by gene and time.
ℹ Output is grouped by gene.
ℹ Use `summarise(.groups = "drop_last")` to silence this message.
ℹ Use `summarise(.by = c(gene, time))` for per-operation grouping
  (`?dplyr::dplyr_by`) instead.
R
rna_time
输出
# A tibble: 1,474 × 4
# Groups:   gene [1,474]
   gene         `0`     `4`     `8`
   <chr>      <dbl>   <dbl>   <dbl>
 1 AI504432 1034.   1104.   1014
 2 AW046200  155.    152.     81
 3 AW551984  238     302.    342.
 4 Aamp     4603.   4870    4763.
 5 Abca12      5.29    4.25    4.14
 6 Abcc8    2576.   2609.   2292.
 7 Abhd14a   591.    547.    432.
 8 Abi2     4881.   4903.   4945.
 9 Abi3bp   1175.   1061.    762.
10 Abl2     2170.   2078.   2131.
# ℹ 1,464 more rows
请注意,这会生成一个部分列名以数字开头的 tibble。如果我们想选择对应于时间点的列,就不能直接使用列名……当我们选择第 4 列时会发生什么?
R
rna |>
  group_by(gene, time) |>
  summarise(mean_exp = mean(expression)) |>
  pivot_wider(names_from = time,
              values_from = mean_exp) |>
  select(gene, 4)
输出
`summarise()` has regrouped the output.
ℹ Summaries were computed grouped by gene and time.
ℹ Output is grouped by gene.
ℹ Use `summarise(.groups = "drop_last")` to silence this message.
ℹ Use `summarise(.by = c(gene, time))` for per-operation grouping
  (`?dplyr::dplyr_by`) instead.
输出
# A tibble: 1,474 × 2
# Groups:   gene [1,474]
   gene         `8`
   <chr>      <dbl>
 1 AI504432 1014
 2 AW046200   81
 3 AW551984  342.
 4 Aamp     4763.
 5 Abca12      4.14
 6 Abcc8    2292.
 7 Abhd14a   432.
 8 Abi2     4945.
 9 Abi3bp    762.
10 Abl2     2131.
# ℹ 1,464 more rows
若要选择时间点 4,我们需要使用反引号 “`” 来引号包裹列名。
R
rna |>
  group_by(gene, time) |>
  summarise(mean_exp = mean(expression)) |>
  pivot_wider(names_from = time,
              values_from = mean_exp) |>
  select(gene, `4`)
输出
`summarise()` has regrouped the output.
ℹ Summaries were computed grouped by gene and time.
ℹ Output is grouped by gene.
ℹ Use `summarise(.groups = "drop_last")` to silence this message.
ℹ Use `summarise(.by = c(gene, time))` for per-operation grouping
  (`?dplyr::dplyr_by`) instead.
输出
# A tibble: 1,474 × 2
# Groups:   gene [1,474]
   gene         `4`
   <chr>      <dbl>
 1 AI504432 1104.
 2 AW046200  152.
 3 AW551984  302.
 4 Aamp     4870
 5 Abca12      4.25
 6 Abcc8    2609.
 7 Abhd14a   547.
 8 Abi2     4903.
 9 Abi3bp   1061.
10 Abl2     2078.
# ℹ 1,464 more rows
另一种方案是重命名该列,选择一个不以数字开头的名称:
R
rna |>
  group_by(gene, time) |>
  summarise(mean_exp = mean(expression)) |>
  pivot_wider(names_from = time,
              values_from = mean_exp) |>
  rename("time0" = `0`, "time4" = `4`, "time8" = `8`) |>
  select(gene, time4)
输出
`summarise()` has regrouped the output.
ℹ Summaries were computed grouped by gene and time.
ℹ Output is grouped by gene.
ℹ Use `summarise(.groups = "drop_last")` to silence this message.
ℹ Use `summarise(.by = c(gene, time))` for per-operation grouping
  (`?dplyr::dplyr_by`) instead.
输出
# A tibble: 1,474 × 2
# Groups:   gene [1,474]
   gene       time4
   <chr>      <dbl>
 1 AI504432 1104.
 2 AW046200  152.
 3 AW551984  302.
 4 Aamp     4870
 5 Abca12      4.25
 6 Abcc8    2609.
 7 Abhd14a   547.
 8 Abi2     4903.
 9 Abi3bp   1061.
10 Abl2     2078.
# ℹ 1,464 more rows问题
使用之前包含每个时间点平均表达水平的数据框,创建一个新列,其中包含时间点 8 与时间点 0 之间的倍数变化,以及时间点 8 与时间点 4 之间的倍数变化。将此表转换为长格式表,汇总计算出的倍数变化。
从 rna_time tibble 开始:
R
rna_time
输出
# A tibble: 1,474 × 4
# Groups:   gene [1,474]
   gene         `0`     `4`     `8`
   <chr>      <dbl>   <dbl>   <dbl>
 1 AI504432 1034.   1104.   1014
 2 AW046200  155.    152.     81
 3 AW551984  238     302.    342.
 4 Aamp     4603.   4870    4763.
 5 Abca12      5.29    4.25    4.14
 6 Abcc8    2576.   2609.   2292.
 7 Abhd14a   591.    547.    432.
 8 Abi2     4881.   4903.   4945.
 9 Abi3bp   1175.   1061.    762.
10 Abl2     2170.   2078.   2131.
# ℹ 1,464 more rows
计算倍数变化:
R
rna_time |>
  mutate(time_8_vs_0 = `8` / `0`, time_8_vs_4 = `8` / `4`)
输出
# A tibble: 1,474 × 6
# Groups:   gene [1,474]
   gene         `0`     `4`     `8` time_8_vs_0 time_8_vs_4
   <chr>      <dbl>   <dbl>   <dbl>       <dbl>       <dbl>
 1 AI504432 1034.   1104.   1014          0.981       0.918
 2 AW046200  155.    152.     81          0.522       0.532
 3 AW551984  238     302.    342.         1.44        1.13
 4 Aamp     4603.   4870    4763.         1.03        0.978
 5 Abca12      5.29    4.25    4.14       0.784       0.975
 6 Abcc8    2576.   2609.   2292.         0.889       0.878
 7 Abhd14a   591.    547.    432.         0.731       0.791
 8 Abi2     4881.   4903.   4945.         1.01        1.01
 9 Abi3bp   1175.   1061.    762.         0.649       0.719
10 Abl2     2170.   2078.   2131.         0.982       1.03
# ℹ 1,464 more rows
并使用 pivot_longer() 函数:
R
rna_time |>
  mutate(time_8_vs_0 = `8` / `0`, time_8_vs_4 = `8` / `4`) |>
  pivot_longer(names_to = "comparisons",
               values_to = "Fold_changes",
               time_8_vs_0:time_8_vs_4)
输出
# A tibble: 2,948 × 6
# Groups:   gene [1,474]
   gene         `0`     `4`     `8` comparisons Fold_changes
   <chr>      <dbl>   <dbl>   <dbl> <chr>              <dbl>
 1 AI504432 1034.   1104.   1014    time_8_vs_0        0.981
 2 AI504432 1034.   1104.   1014    time_8_vs_4        0.918
 3 AW046200  155.    152.     81    time_8_vs_0        0.522
 4 AW046200  155.    152.     81    time_8_vs_4        0.532
 5 AW551984  238     302.    342.   time_8_vs_0        1.44
 6 AW551984  238     302.    342.   time_8_vs_4        1.13
 7 Aamp     4603.   4870    4763.   time_8_vs_0        1.03
 8 Aamp     4603.   4870    4763.   time_8_vs_4        0.978
 9 Abca12      5.29    4.25    4.14 time_8_vs_0        0.784
10 Abca12      5.29    4.25    4.14 time_8_vs_4        0.975
# ℹ 2,938 more rows
连接表
在许多实际场景中,数据分布在多个表格中。这通常是因为不同类型的信息是从不同的来源收集的。
在某些分析中,可能需要根据一个所有表格共有的列,将两个或多个表格的数据合并为一个数据框。
dplyr
包提供了一组连接函数,用于根据指定列中的匹配项将两个数据框合并。在此,我们将简要介绍连接操作。如需进一步阅读,请参阅关于
表连接
的章节。数据转换速查表
也提供了关于表连接的简要概述。
我们将使用一个小表 rna_mini
来演示连接操作,该表我们将通过对原始表 rna
进行子集提取,仅保留 3 列和 10 行来创建。
R
rna_mini <- rna |>
   select(gene, sample, expression) |>
   head(10)
rna_mini
输出
# A tibble: 10 × 3
   gene    sample     expression
   <chr>   <chr>           <dbl>
 1 Asl     GSM2545336       1170
 2 Apod    GSM2545336      36194
 3 Cyp2d22 GSM2545336       4060
 4 Klk6    GSM2545336        287
 5 Fcrls   GSM2545336         85
 6 Slc2a4  GSM2545336        782
 7 Exd2    GSM2545336       1619
 8 Gjc2    GSM2545336        288
 9 Plp1    GSM2545336      43217
10 Gnb4    GSM2545336       1071
第二张表 annot1 包含 2 列:gene 和
gene_description。您可以点击链接 下载
annot1.csv 并将其移至 data/ 文件夹,或者使用下面的 R
代码将其直接下载到该文件夹。
R
download.file(url = "https://carpentries-incubator.github.io/bioc-intro/data/annot1.csv",
              destfile = "data/annot1.csv")
annot1 <- read_csv(file = "data/annot1.csv")
annot1
输出
# A tibble: 10 × 2
   gene    gene_description
   <chr>   <chr>
 1 Cyp2d22 cytochrome P450, family 2, subfamily d, polypeptide 22 [Source:MGI S…
 2 Klk6    kallikrein related-peptidase 6 [Source:MGI Symbol;Acc:MGI:1343166]
 3 Fcrls   Fc receptor-like S, scavenger receptor [Source:MGI Symbol;Acc:MGI:19…
 4 Plp1    proteolipid protein (myelin) 1 [Source:MGI Symbol;Acc:MGI:97623]
 5 Exd2    exonuclease 3'-5' domain containing 2 [Source:MGI Symbol;Acc:MGI:192…
 6 Apod    apolipoprotein D [Source:MGI Symbol;Acc:MGI:88056]
 7 Gnb4    guanine nucleotide binding protein (G protein), beta 4 [Source:MGI S…
 8 Slc2a4  solute carrier family 2 (facilitated glucose transporter), member 4 …
 9 Asl     argininosuccinate lyase [Source:MGI Symbol;Acc:MGI:88084]
10 Gjc2    gap junction protein, gamma 2 [Source:MGI Symbol;Acc:MGI:2153060]
现在,我们想使用 dplyr 包中的 full_join()
函数将这两个表合并为一个包含所有变量的表。该函数会自动寻找公共变量,以匹配第一张表和第二张表的列。在本例中,gene
就是公共变量。这类变量被称为键。键用于在不同表之间匹配观测值。
R
full_join(rna_mini, annot1)
输出
Joining with `by = join_by(gene)`输出
# A tibble: 10 × 4
   gene    sample     expression gene_description
   <chr>   <chr>           <dbl> <chr>
 1 Asl     GSM2545336       1170 argininosuccinate lyase [Source:MGI Symbol;Acc…
 2 Apod    GSM2545336      36194 apolipoprotein D [Source:MGI Symbol;Acc:MGI:88…
 3 Cyp2d22 GSM2545336       4060 cytochrome P450, family 2, subfamily d, polype…
 4 Klk6    GSM2545336        287 kallikrein related-peptidase 6 [Source:MGI Sym…
 5 Fcrls   GSM2545336         85 Fc receptor-like S, scavenger receptor [Source…
 6 Slc2a4  GSM2545336        782 solute carrier family 2 (facilitated glucose t…
 7 Exd2    GSM2545336       1619 exonuclease 3'-5' domain containing 2 [Source:…
 8 Gjc2    GSM2545336        288 gap junction protein, gamma 2 [Source:MGI Symb…
 9 Plp1    GSM2545336      43217 proteolipid protein (myelin) 1 [Source:MGI Sym…
10 Gnb4    GSM2545336       1071 guanine nucleotide binding protein (G protein)…
在实际应用中,基因注释有时会采用不同的标注方式。
annot2 表与 annot1
完全相同,仅将包含基因名称的变量标注不同。同样,您可以自行 下载
annot2.csv 并将其移至 data/,或者使用下面的 R
代码。
R
download.file(url = "https://carpentries-incubator.github.io/bioc-intro/data/annot2.csv",
              destfile = "data/annot2.csv")
annot2 <- read_csv(file = "data/annot2.csv")
annot2
输出
# A tibble: 10 × 2
   external_gene_name description
   <chr>              <chr>
 1 Cyp2d22            cytochrome P450, family 2, subfamily d, polypeptide 22 [S…
 2 Klk6               kallikrein related-peptidase 6 [Source:MGI Symbol;Acc:MGI…
 3 Fcrls              Fc receptor-like S, scavenger receptor [Source:MGI Symbol…
 4 Plp1               proteolipid protein (myelin) 1 [Source:MGI Symbol;Acc:MGI…
 5 Exd2               exonuclease 3'-5' domain containing 2 [Source:MGI Symbol;…
 6 Apod               apolipoprotein D [Source:MGI Symbol;Acc:MGI:88056]
 7 Gnb4               guanine nucleotide binding protein (G protein), beta 4 [S…
 8 Slc2a4             solute carrier family 2 (facilitated glucose transporter)…
 9 Asl                argininosuccinate lyase [Source:MGI Symbol;Acc:MGI:88084]
10 Gjc2               gap junction protein, gamma 2 [Source:MGI Symbol;Acc:MGI:…
如果没有任何变量名匹配,我们可以手动设置用于匹配的变量。这些变量可以通过
by 参数来设置,如下面 rna_mini 和
annot2 表所示。
R
full_join(rna_mini, annot2, by = c("gene" = "external_gene_name"))
输出
# A tibble: 10 × 4
   gene    sample     expression description
   <chr>   <chr>           <dbl> <chr>
 1 Asl     GSM2545336       1170 argininosuccinate lyase [Source:MGI Symbol;Acc…
 2 Apod    GSM2545336      36194 apolipoprotein D [Source:MGI Symbol;Acc:MGI:88…
 3 Cyp2d22 GSM2545336       4060 cytochrome P450, family 2, subfamily d, polype…
 4 Klk6    GSM2545336        287 kallikrein related-peptidase 6 [Source:MGI Sym…
 5 Fcrls   GSM2545336         85 Fc receptor-like S, scavenger receptor [Source…
 6 Slc2a4  GSM2545336        782 solute carrier family 2 (facilitated glucose t…
 7 Exd2    GSM2545336       1619 exonuclease 3'-5' domain containing 2 [Source:…
 8 Gjc2    GSM2545336        288 gap junction protein, gamma 2 [Source:MGI Symb…
 9 Plp1    GSM2545336      43217 proteolipid protein (myelin) 1 [Source:MGI Sym…
10 Gnb4    GSM2545336       1071 guanine nucleotide binding protein (G protein)…
如上所示,第一个表的变量名在合并后的表中得以保留。
挑战:
点击此链接下载
annot3 表,并将该表放入你的 data/ 存储库中。使用
full_join() 函数,将 rna_mini 和
annot3 表进行连接。基因
Klk6、mt-Tf、mt-Rnr1、mt-Tv、mt-Rnr2
和 mt-Tl1 发生了什么变化?
R
annot3 <- read_csv("data/annot3.csv")
full_join(rna_mini, annot3)
输出
# A tibble: 15 × 4
   gene    sample     expression gene_description
   <chr>   <chr>           <dbl> <chr>
 1 Asl     GSM2545336       1170 argininosuccinate lyase [Source:MGI Symbol;Acc…
 2 Apod    GSM2545336      36194 apolipoprotein D [Source:MGI Symbol;Acc:MGI:88…
 3 Cyp2d22 GSM2545336       4060 cytochrome P450, family 2, subfamily d, polype…
 4 Klk6    GSM2545336        287 <NA>
 5 Fcrls   GSM2545336         85 Fc receptor-like S, scavenger receptor [Source…
 6 Slc2a4  GSM2545336        782 solute carrier family 2 (facilitated glucose t…
 7 Exd2    GSM2545336       1619 exonuclease 3'-5' domain containing 2 [Source:…
 8 Gjc2    GSM2545336        288 gap junction protein, gamma 2 [Source:MGI Symb…
 9 Plp1    GSM2545336      43217 proteolipid protein (myelin) 1 [Source:MGI Sym…
10 Gnb4    GSM2545336       1071 guanine nucleotide binding protein (G protein)…
11 mt-Tf   <NA>               NA mitochondrially encoded tRNA phenylalanine [So…
12 mt-Rnr1 <NA>               NA mitochondrially encoded 12S rRNA [Source:MGI S…
13 mt-Tv   <NA>               NA mitochondrially encoded tRNA valine [Source:MG…
14 mt-Rnr2 <NA>               NA mitochondrially encoded 16S rRNA [Source:MGI S…
15 mt-Tl1  <NA>               NA mitochondrially encoded tRNA leucine 1 [Source…
基因 Klk6 仅存在于 rna_mini 中,而基因
mt-Tf、mt-Rnr1、mt-Tv、mt-Rnr2 和
mt-Tl1 仅存在于 annot3
表中。它们在该表变量中的相应值均被编码为缺失值。
导出数据
既然您已经学会了如何使用 dplyr
从原始数据中提取信息或进行汇总,您可能想要导出这些新数据集,以便与合作者共享或用于存档。
与用于将 CSV 文件读取到 R 中的 read_csv()
函数类似,还有一个 write_csv() 函数可从数据框生成 CSV
文件。
在使用 write_csv()
之前,我们将在工作目录中创建一个新文件夹
data_output,用于存储此生成的数据集。我们不希望将生成的数据集写入与原始数据相同的目录中。将两者分开存放是一个良好的实践。data
文件夹应仅包含原始且未经修改的数据,且应保持原样,以确保不会将其删除或修改。相比之下,我们的脚本将生成
data_output
文件夹中的内容,因此即使其中的文件被删除,我们也始终可以重新生成它们。
让我们使用 write_csv() 来保存我们之前创建的 rna_wide
表格。
R
write_csv(rna_wide, file = "data_output/rna_wide.csv")
- 使用 tidyverse 元包在 R 中处理表格数据