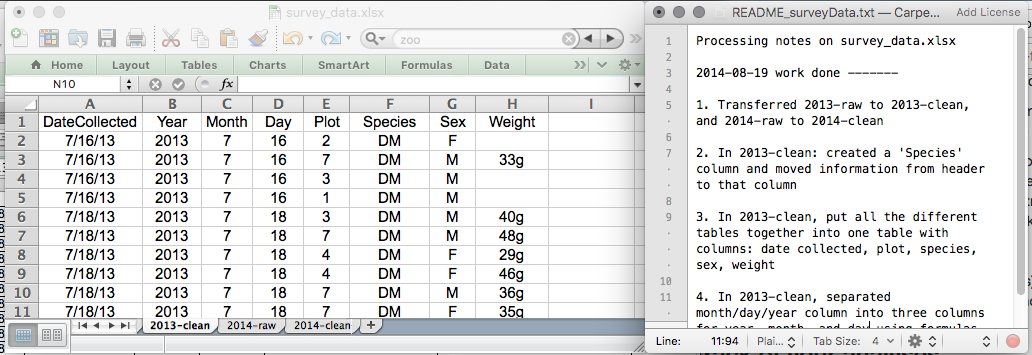
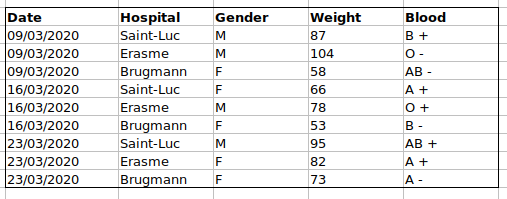
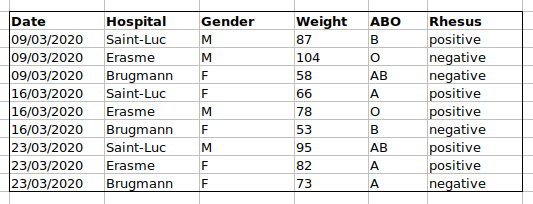
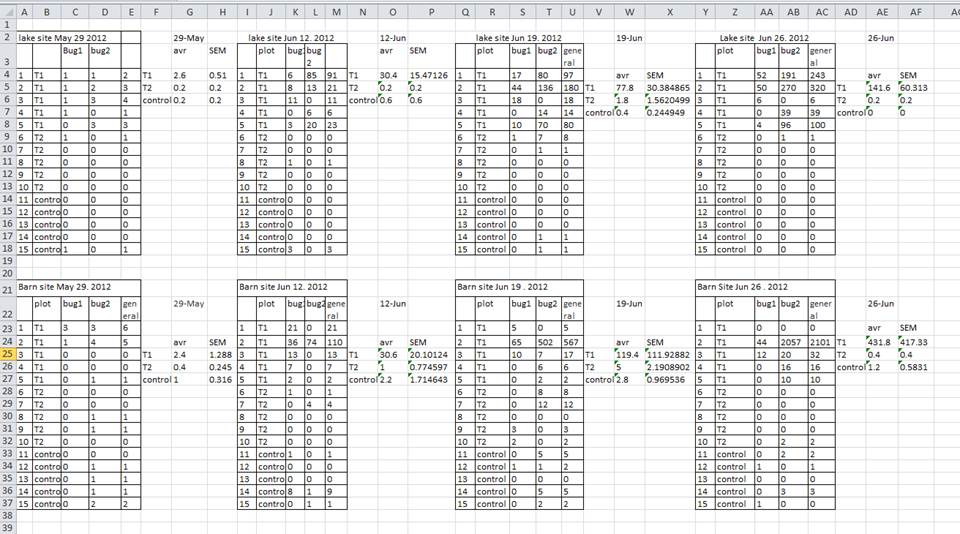
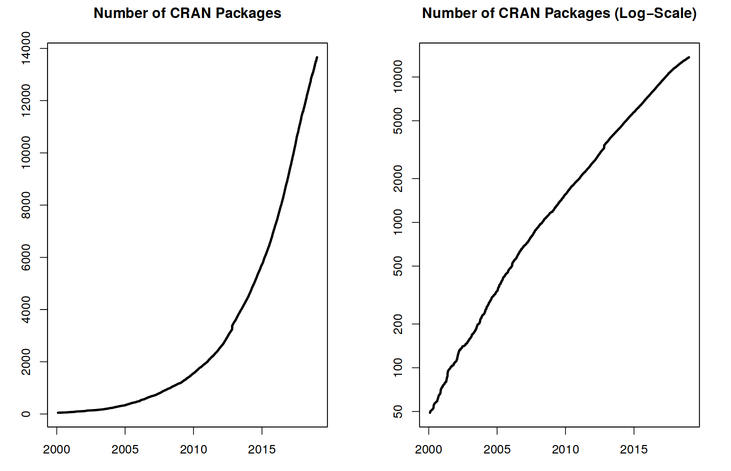
Imagen 1 de 1: ‘Two graphs showing the exponential increase of the number of CRAN packages from 2000 to 2018. The figure on the right shows linear trend for the log of number of packages.’
Exponential increase of the number of packages available on CRAN, the Comprehensive R Archive
Network. From the R Journal, Volume 10/2, December 2018.
Figura 2
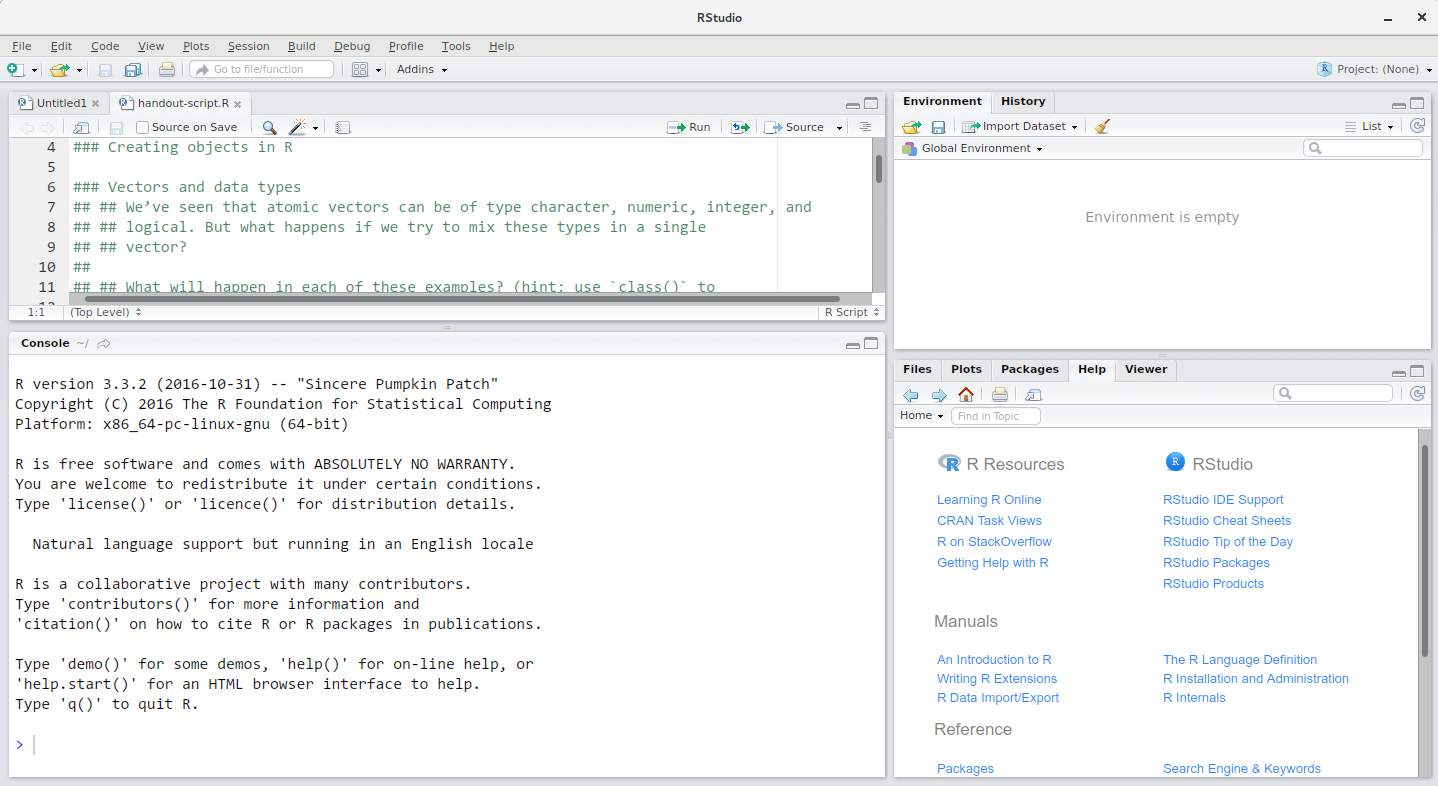
Imagen 1 de 1: ‘Screenshot of the RStudio interface showing the typical four panel setup.’
RStudio interface screenshot. Clockwise from top left: Source,
Environment/History, Files/Plots/Packages/Help/Viewer, Console.
Figura 3
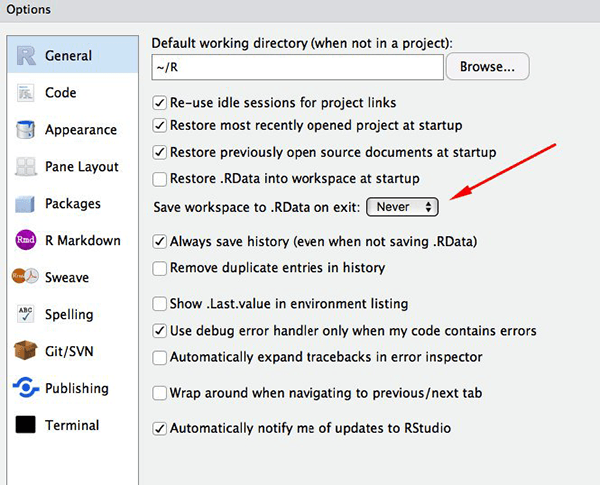
Imagen 1 de 1: ‘Screenshot of the RStudio General Options panel.’
Set ‘Save workspace to .RData on exit’ to ‘Never’
Figura 4
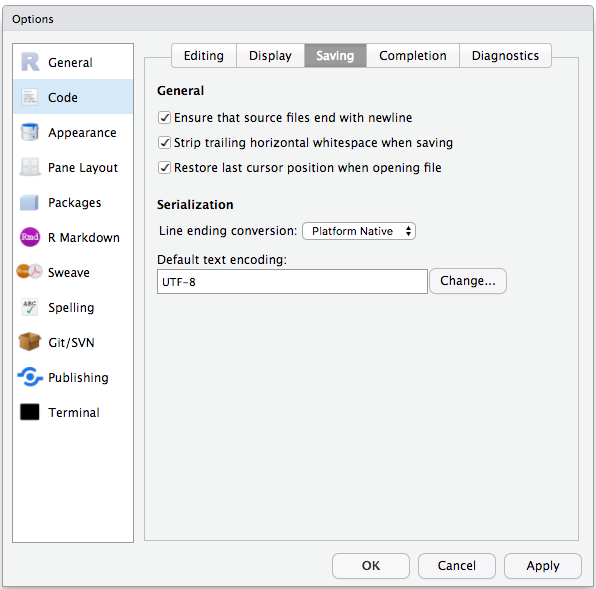
Imagen 1 de 1: ‘Screenshot of the RStudio Code Options panel.’
Set the default text encoding to UTF-8 to save us headache in the coming
future. (Figure from the link above).
Figura 5
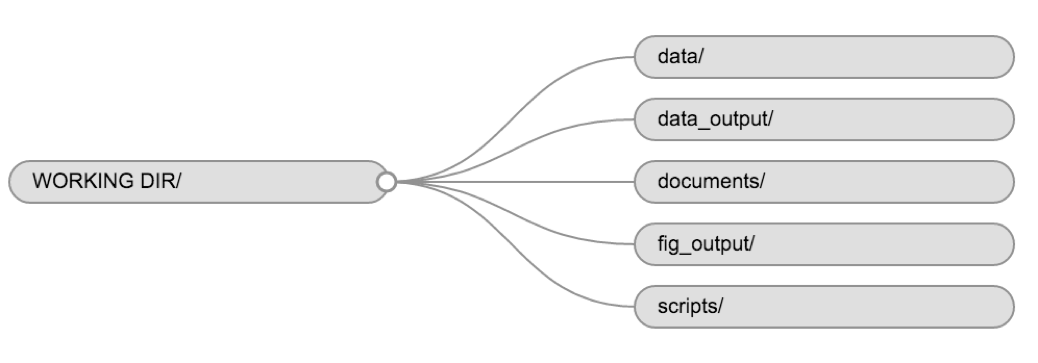
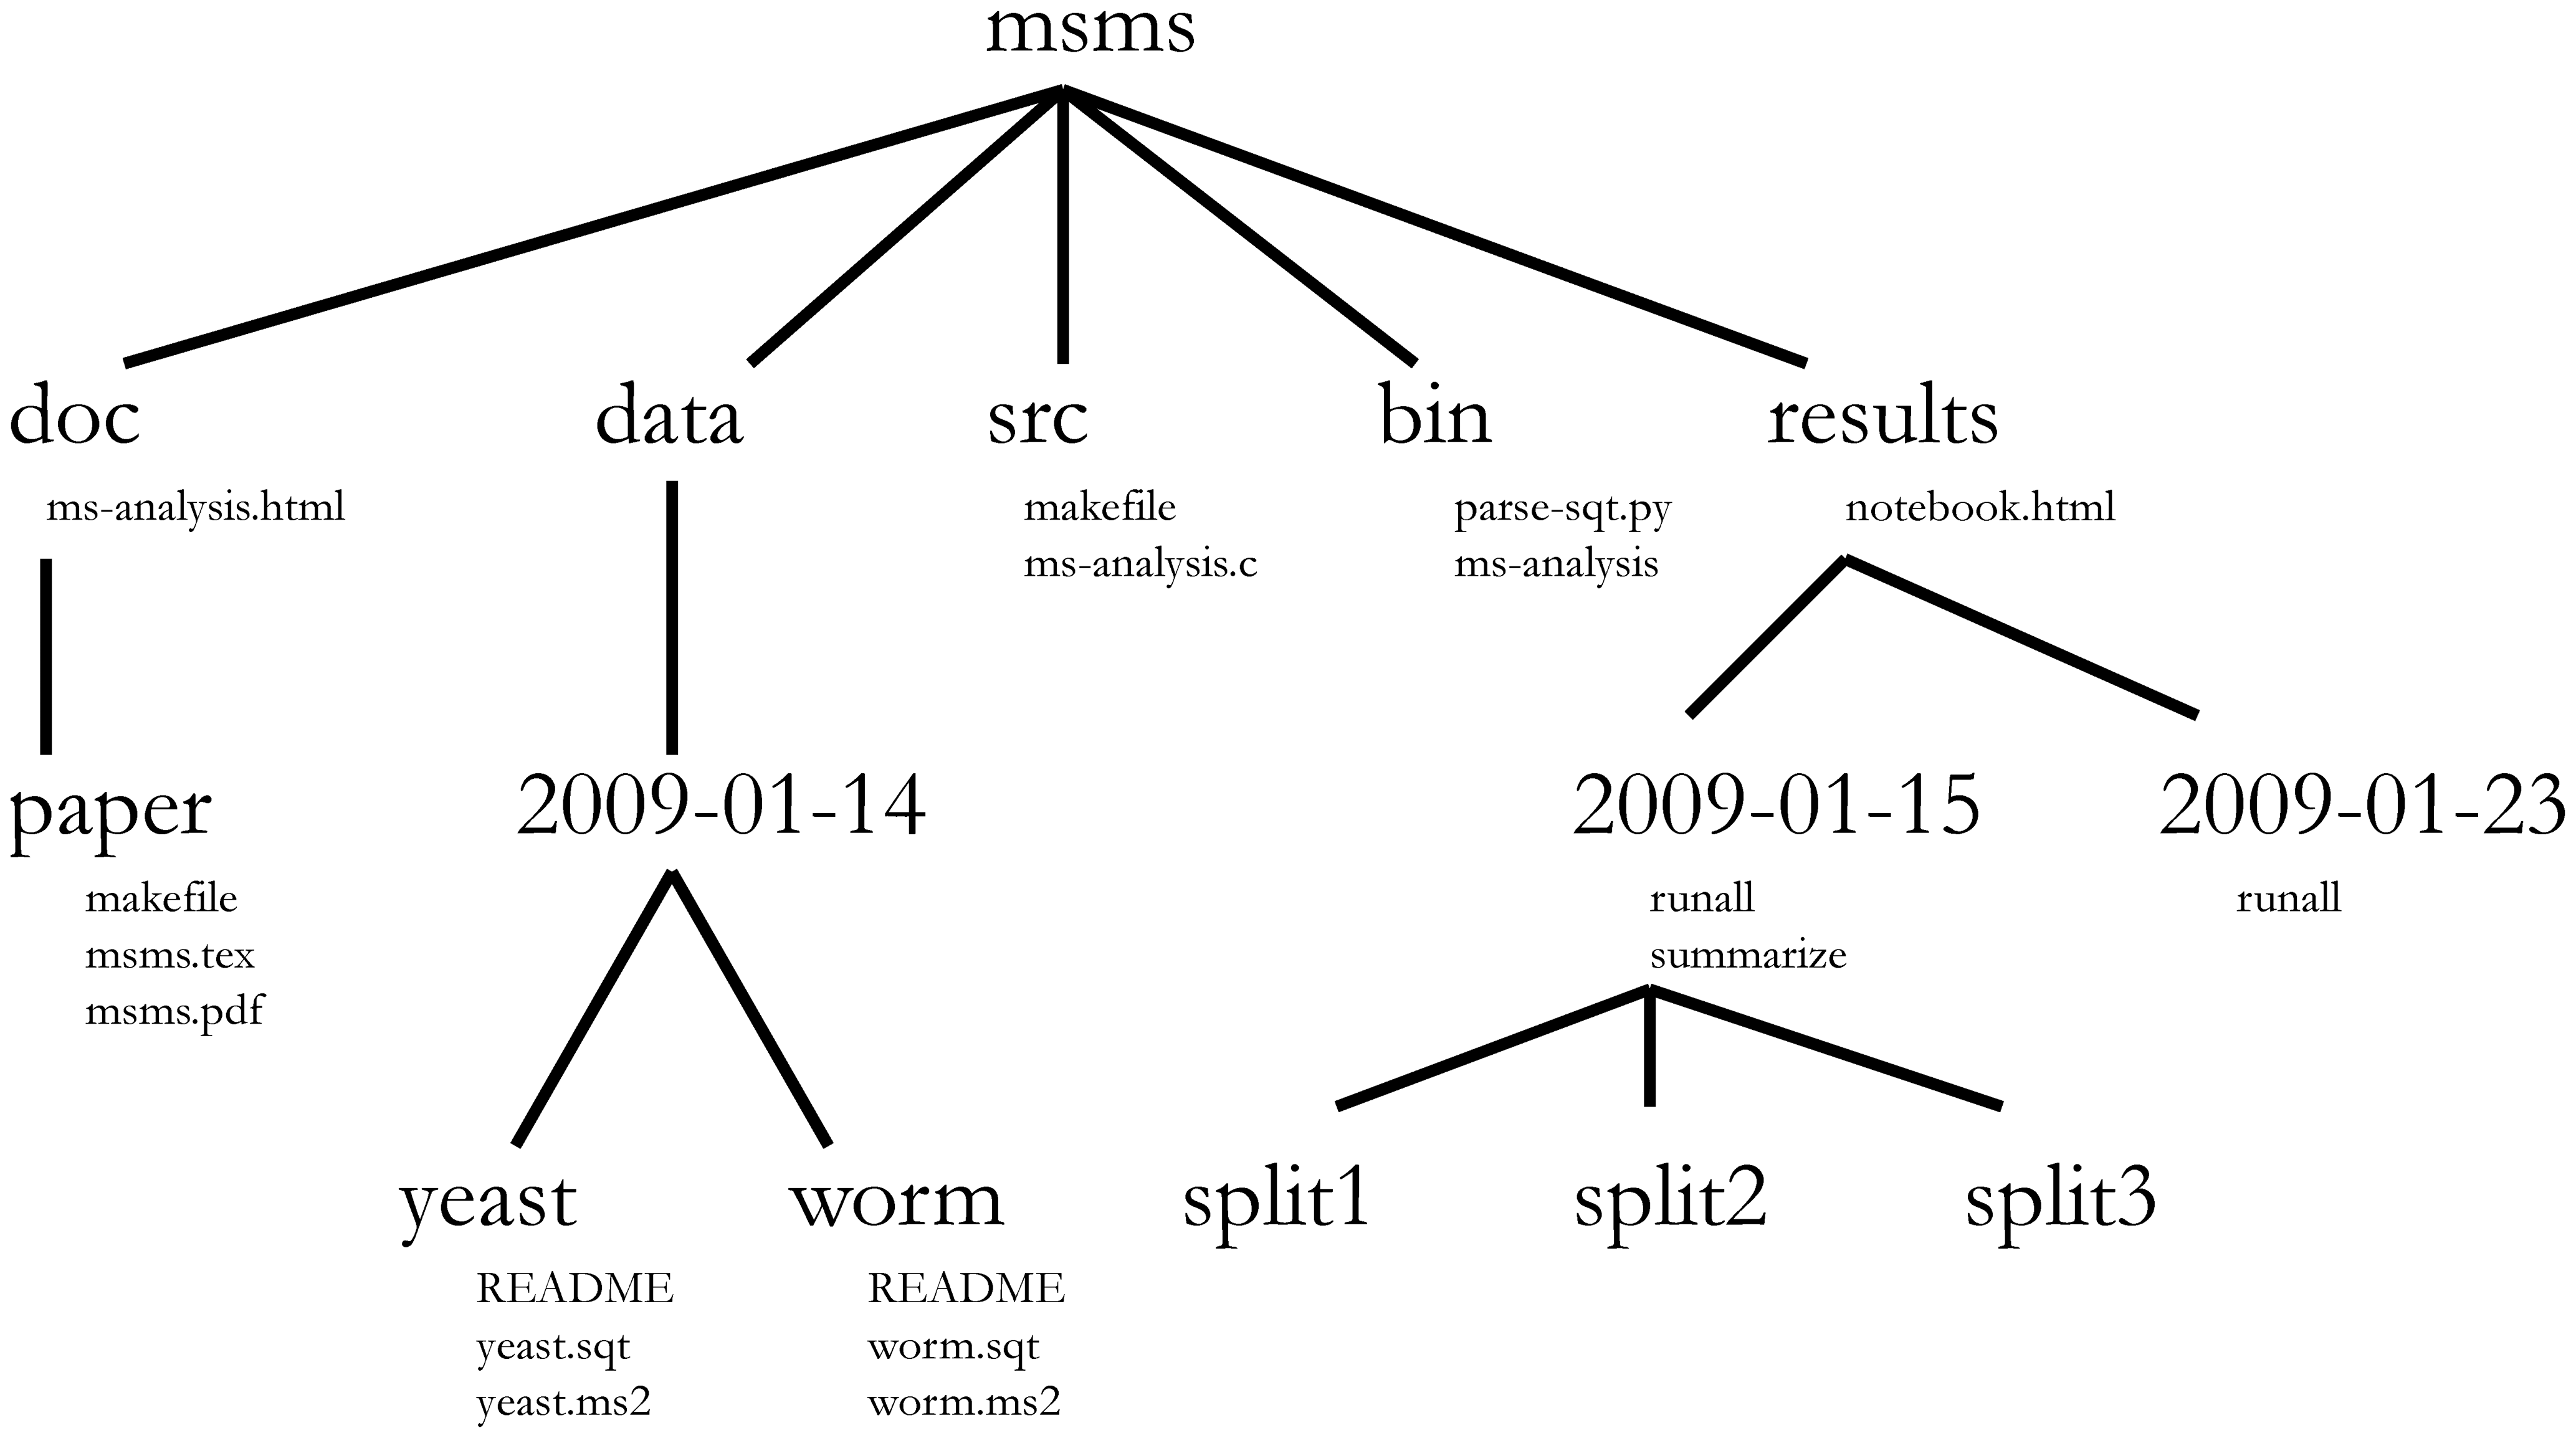
Imagen 1 de 1: ‘Flow diagram showing the structure of the working directory and various directory of a typical RStuio project.’
Example of a working directory structure.
Figura 6
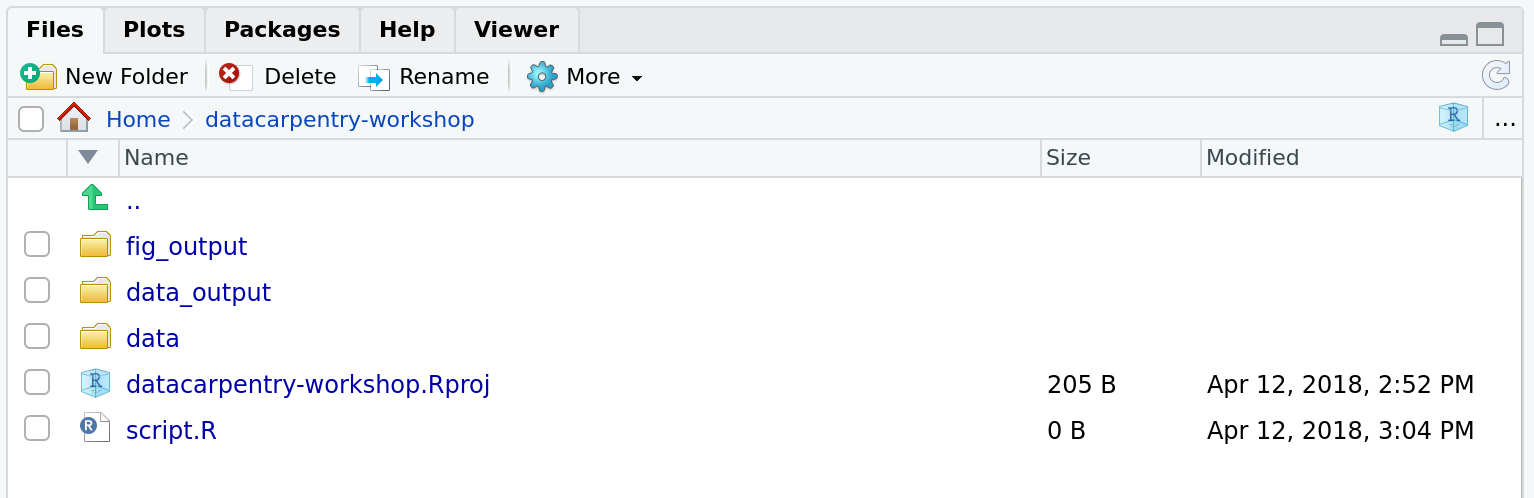
Imagen 1 de 1: ‘Screenshot of RStudio's Files panel.’
How it should look like at the beginning of this lesson
Figura 7
Imagen 1 de 1: ‘Figure form Nobel et al. (2009) showing a complex bioinformatics project structure.’
Directory structure for a sample bioinformatics project.
Figura 8
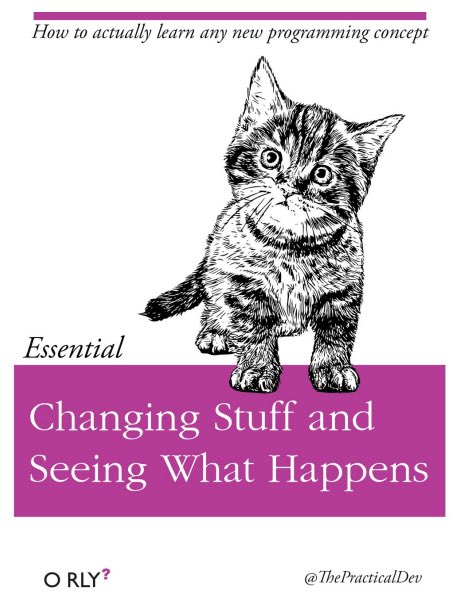
Imagen 1 de 1: ‘Fake book cover showing a kitten with title 'Changing Stuff and Seeing What Happens.'’
Figura 9
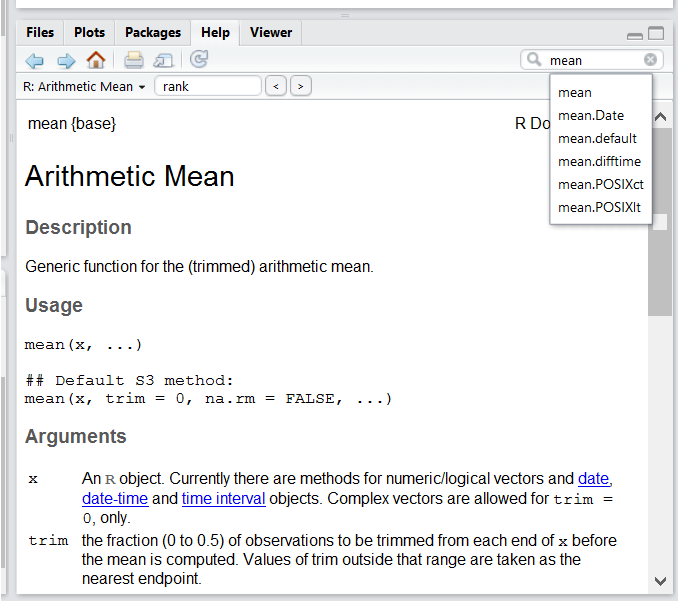
Imagen 1 de 1: ‘Screenshot of RStudio's Help panel.’
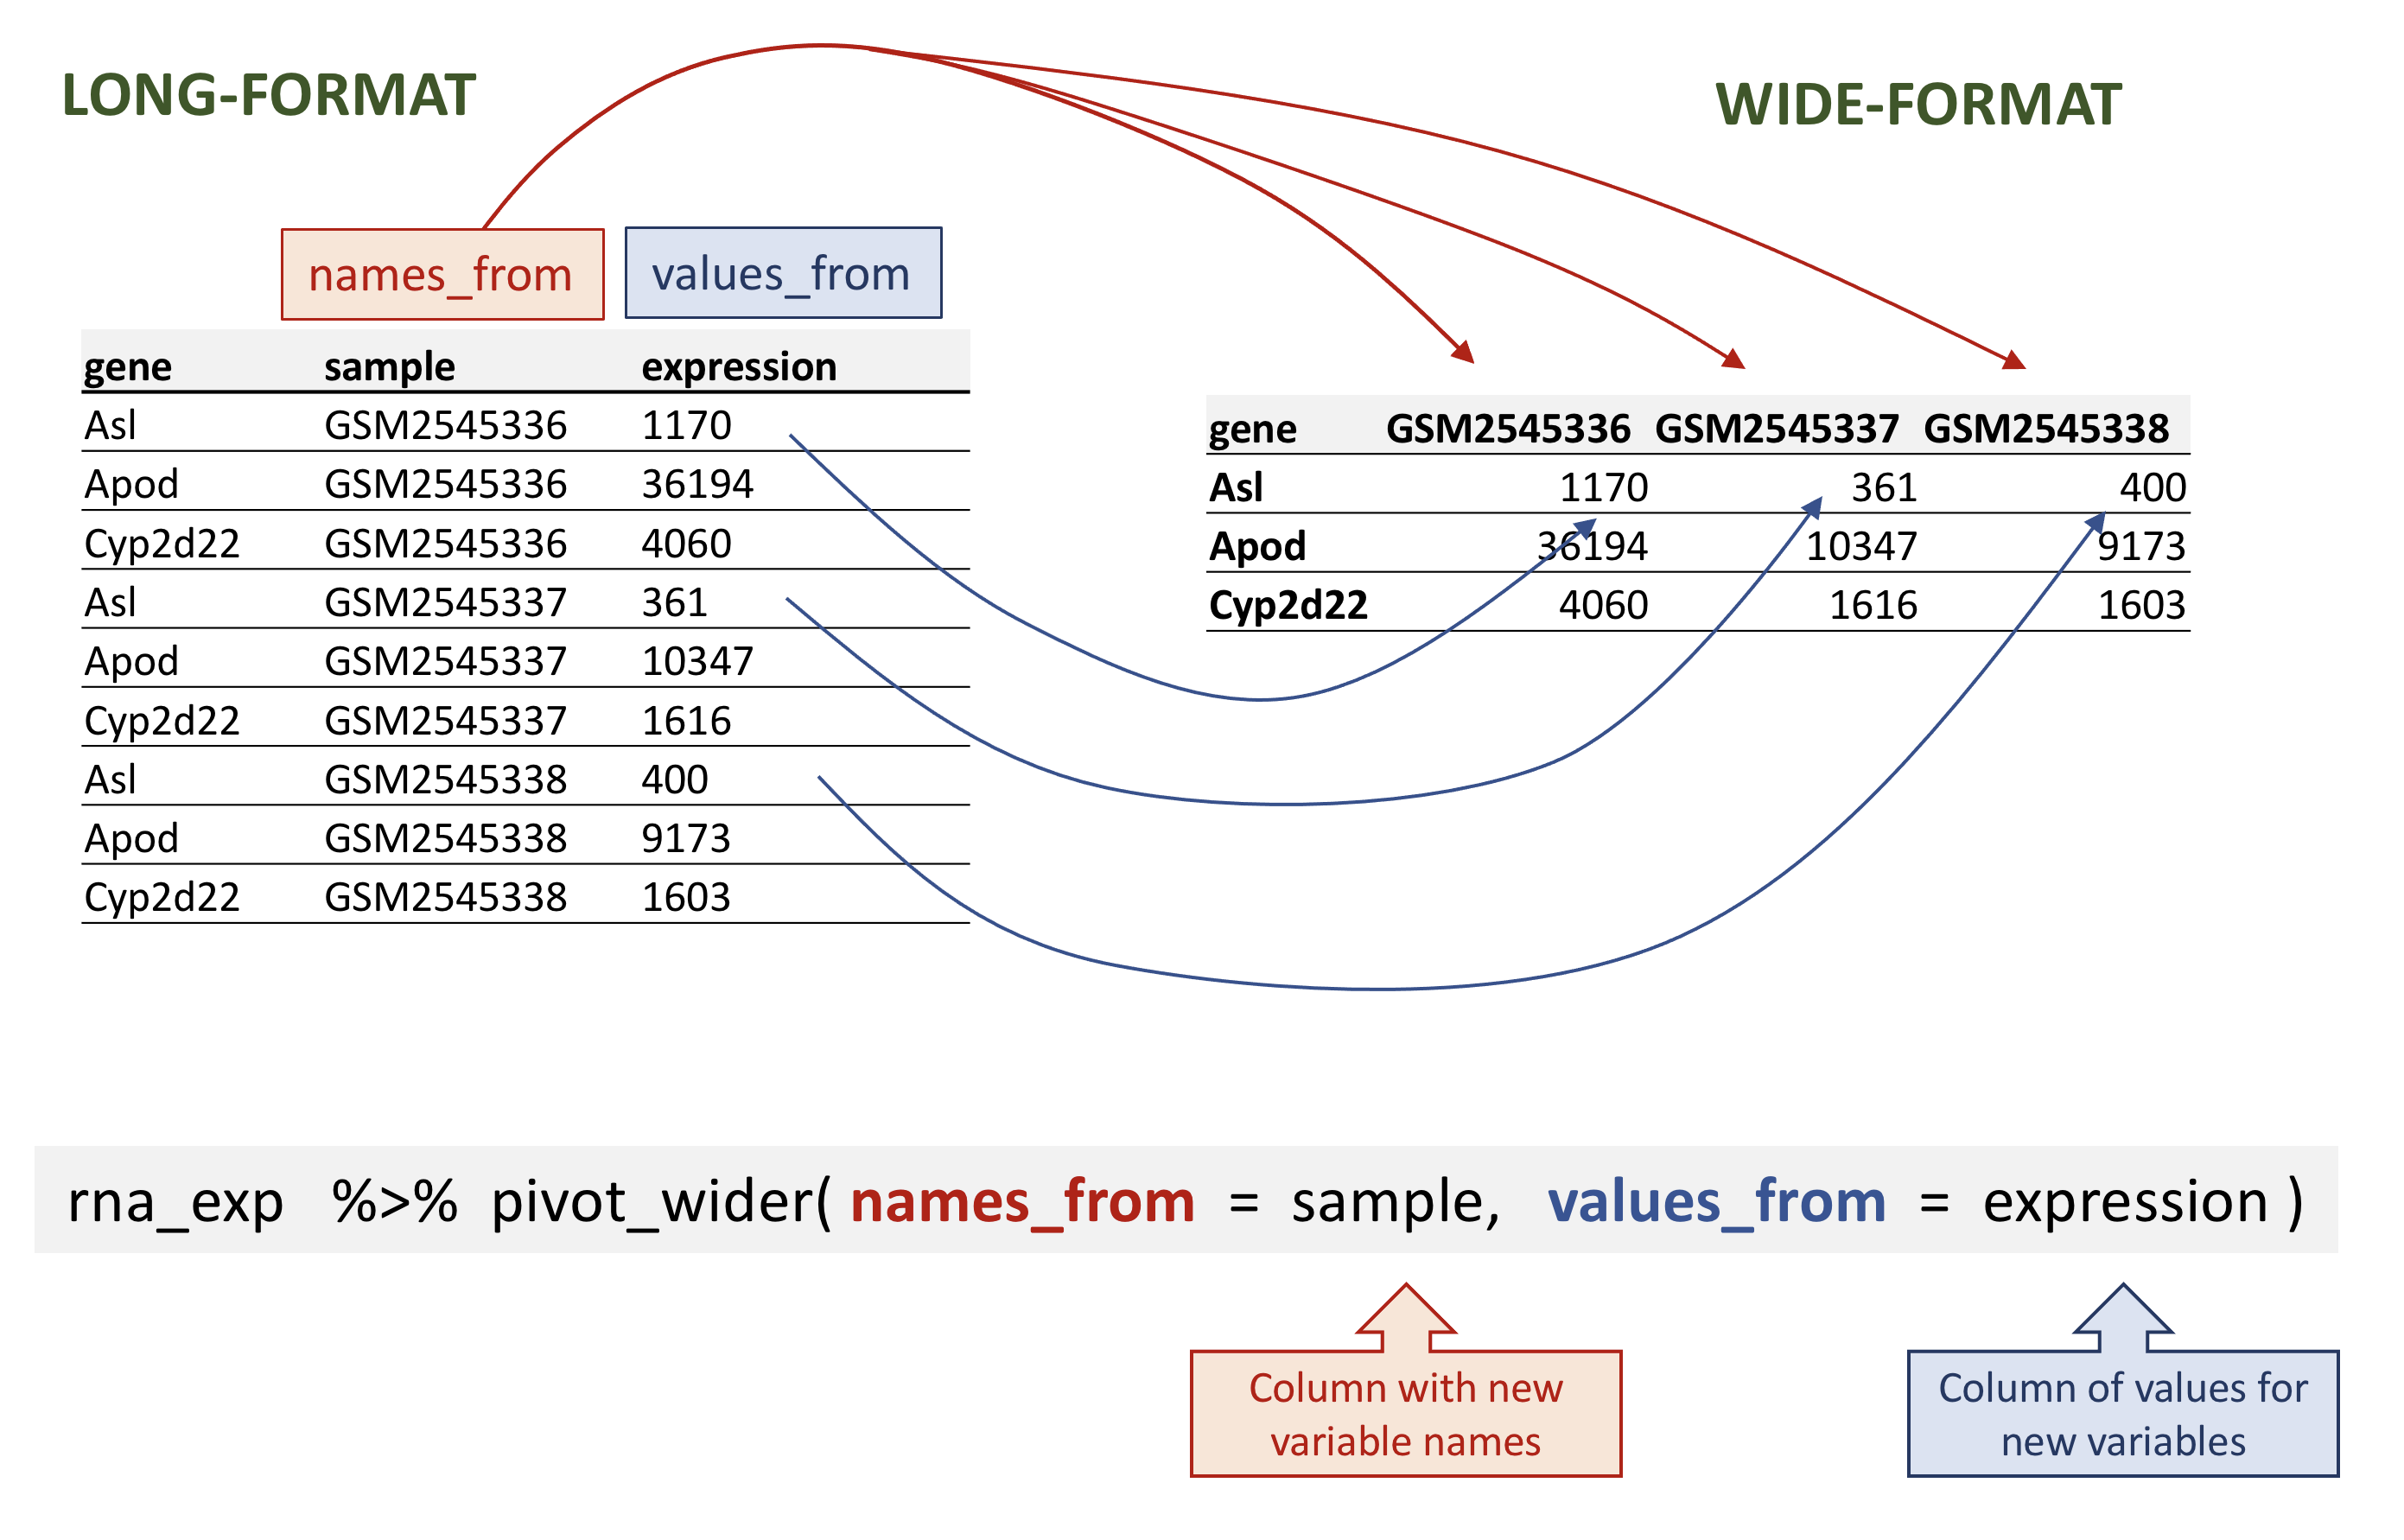
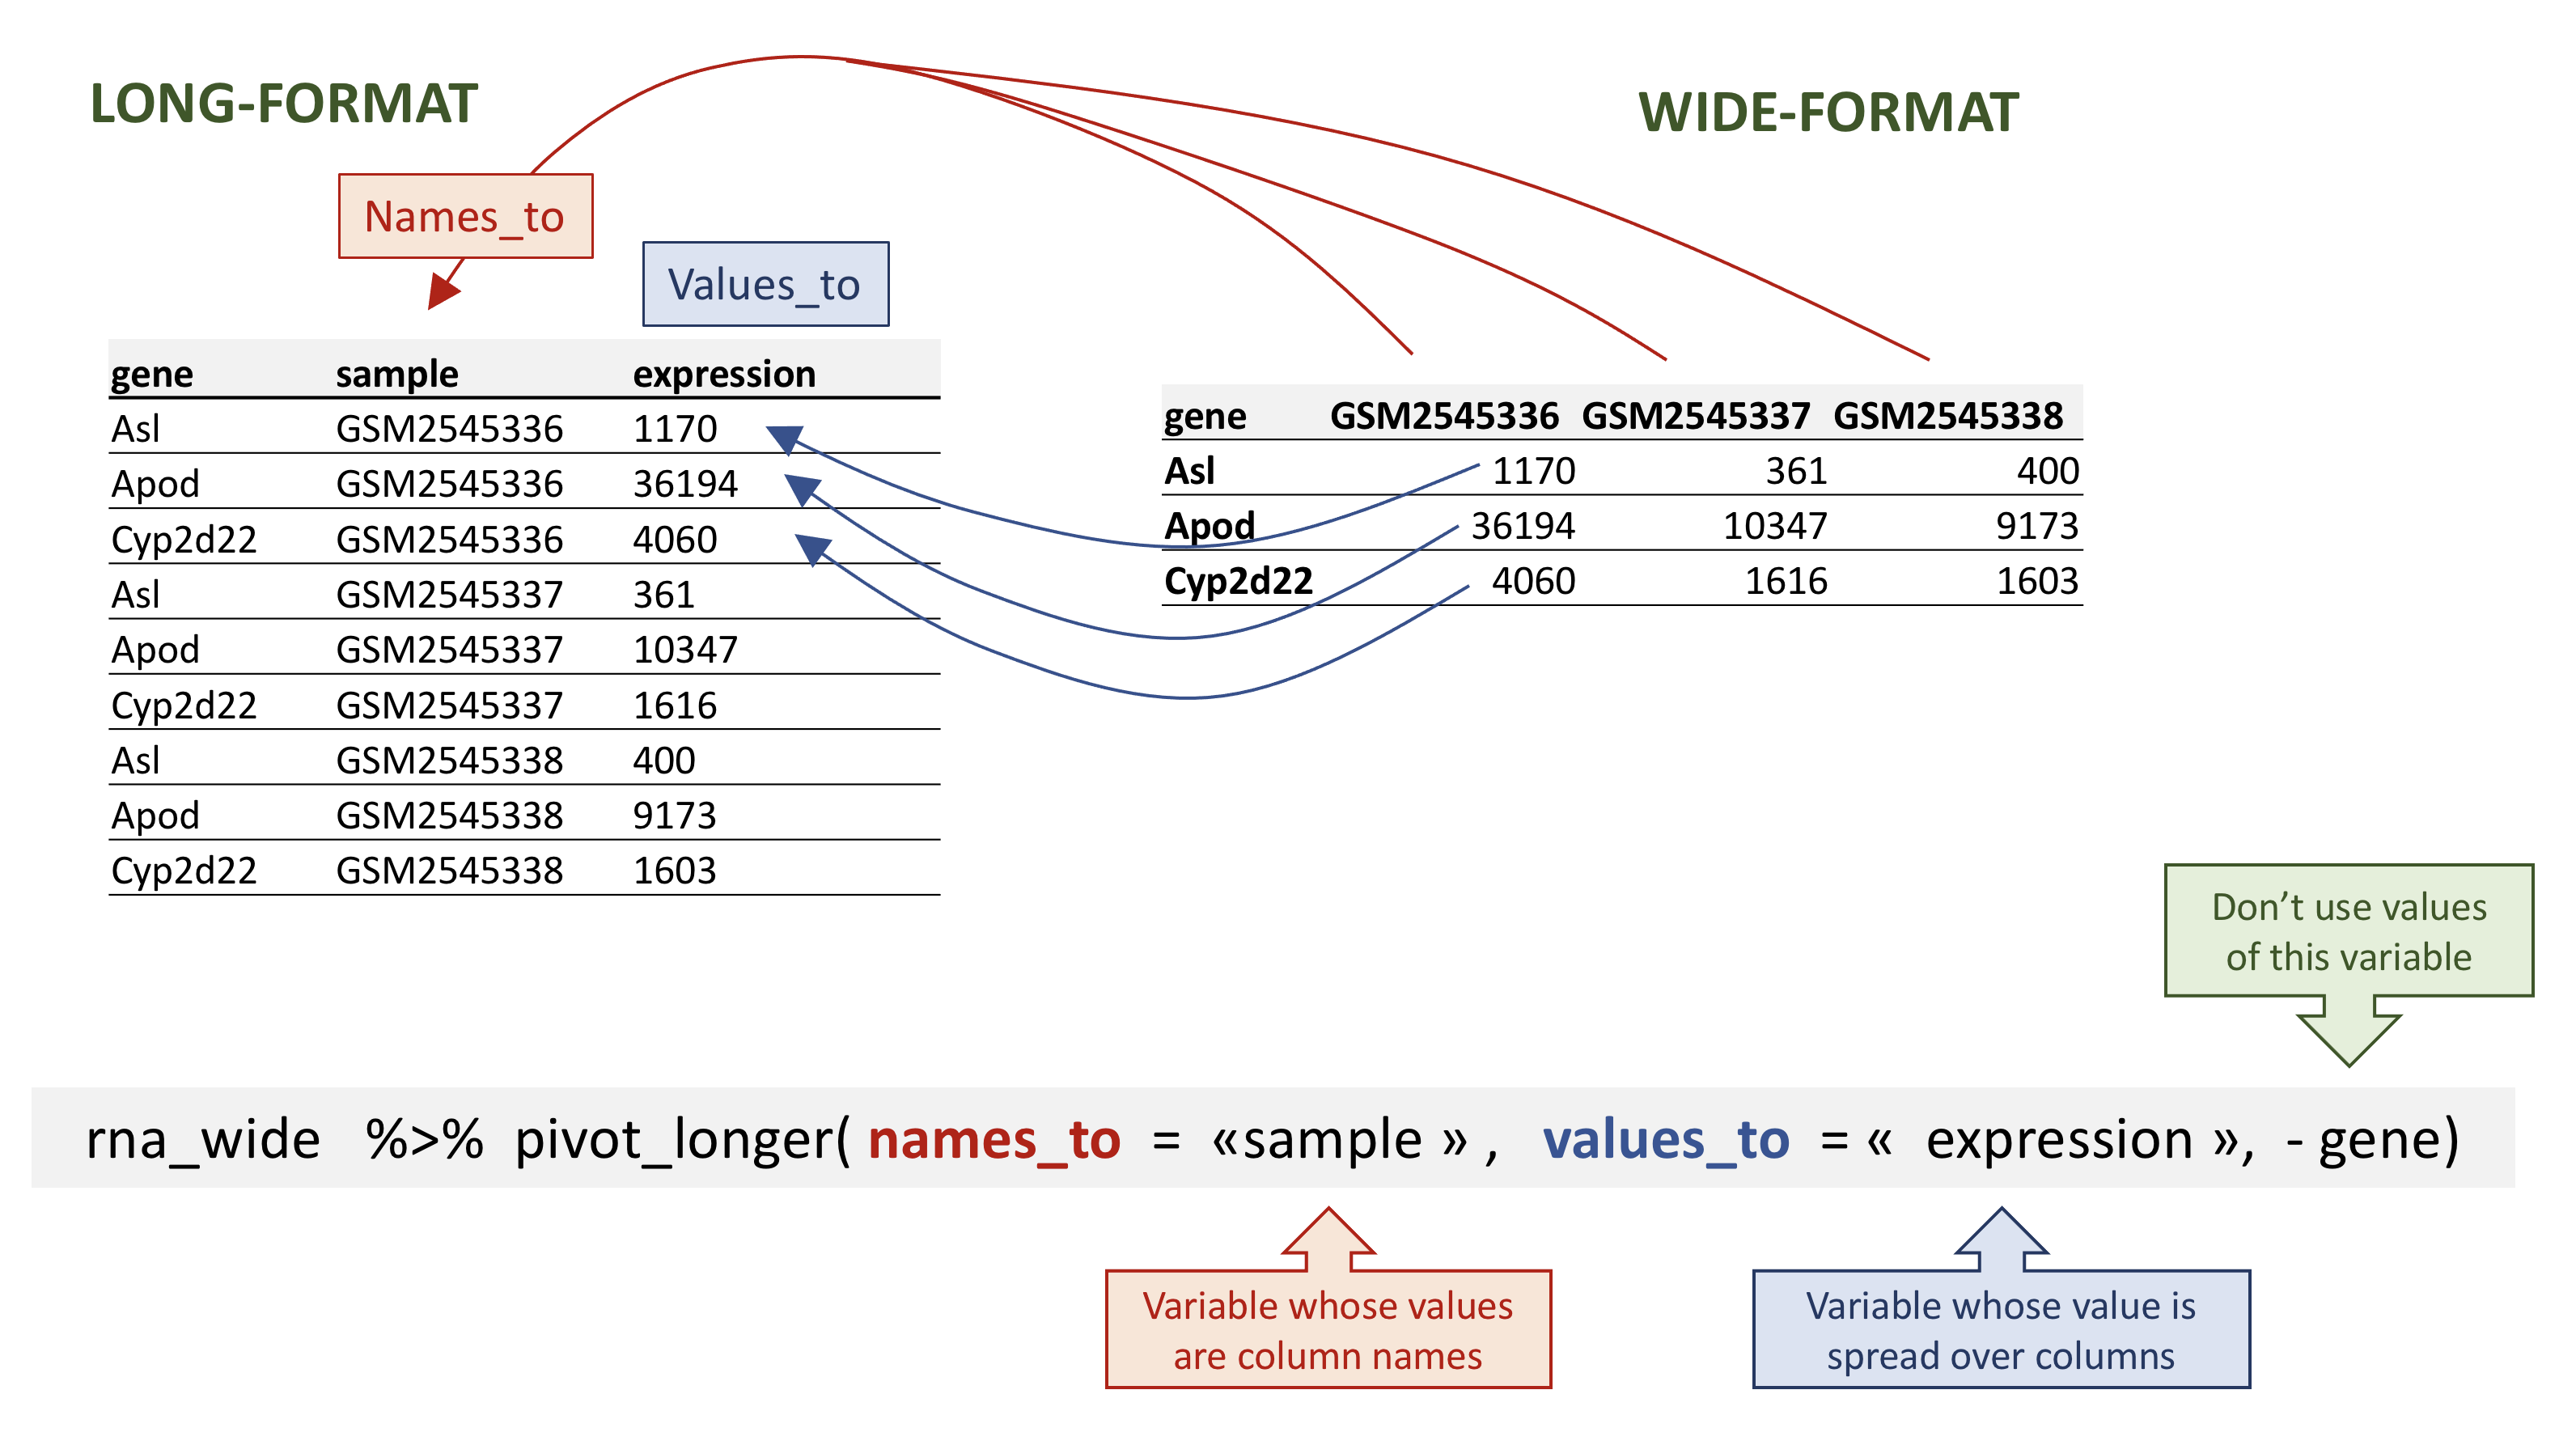
Imagen 1 de 1: ‘Figure showing the long table format on the left and wide table format on the right and arrows illustrating how the values in the 'sample' column on the left have become column names on the right and how the values in the 'expression' column on the left have become values on the the right. Below is the call to 'pivot_wider()' with annotations pointing to the 'sample' and 'expression' function arguments.’
Wide pivot of the rna data.
Figura 2
Imagen 1 de 1: ‘Figure showing the long table format on the left and wide table format on the right and arrows illustrating how the column names on the left have become a new column 'sample' on the left and the values in the wide table on the right have become a new column 'expression' on the left. Below is the call to 'pivot_wider()' with annotations pointing to the 'sample', 'expression' and the '-gene' arguments.’
Long pivot of the rna data.
Figura 3
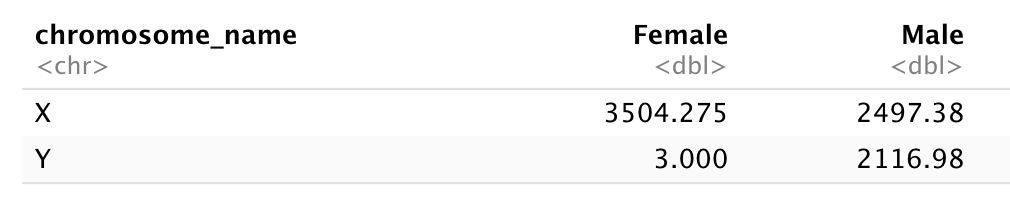
Imagen 1 de 1: ‘A two by two table with X and Y row names and Female and Male column names showing the total counts for each X/Y and Female/Male combination. The Y/Female combinations shows 3 counts, while all other counts are above 2000 counts.’
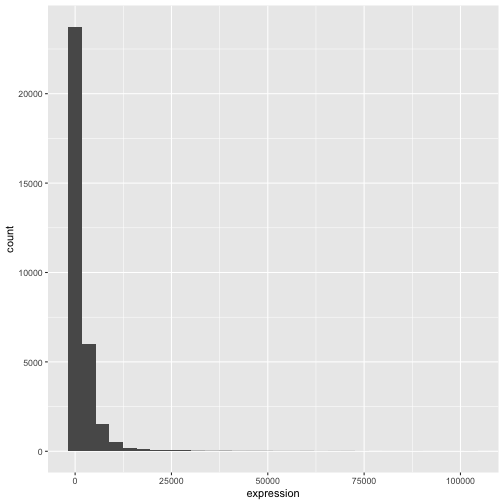
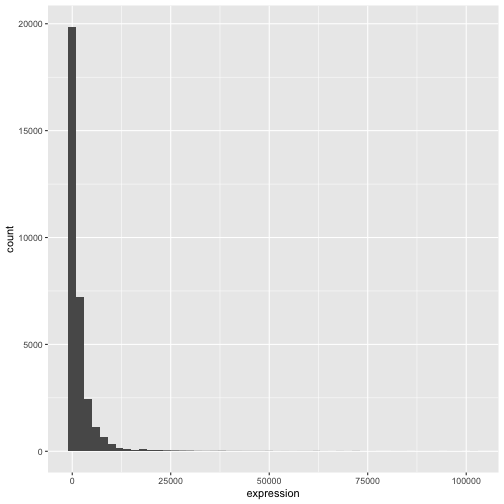
Imagen 1 de 1: ‘Default histogram produced by ggplot() and geom_histogram() for the expression data.’
Figura 2
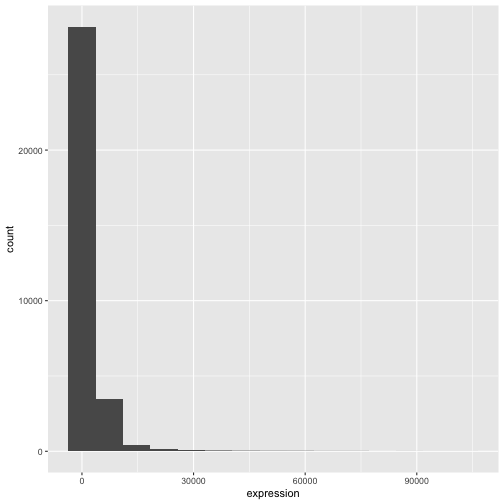
Imagen 1 de 1: ‘Histograms produced by ggplot() and geom_histogram() for the expression data with bin set of 15 (top) and binwith set to 2000 (bottom).’
Figura 3
Imagen 1 de 1: ‘Histograms produced by ggplot() and geom_histogram() for the expression data with bin set of 15 (top) and binwith set to 2000 (bottom).’
Figura 4
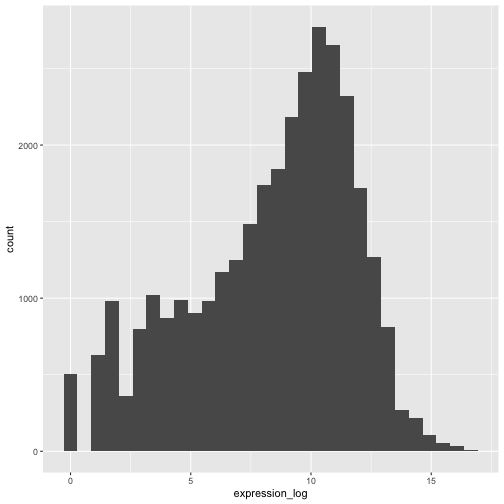
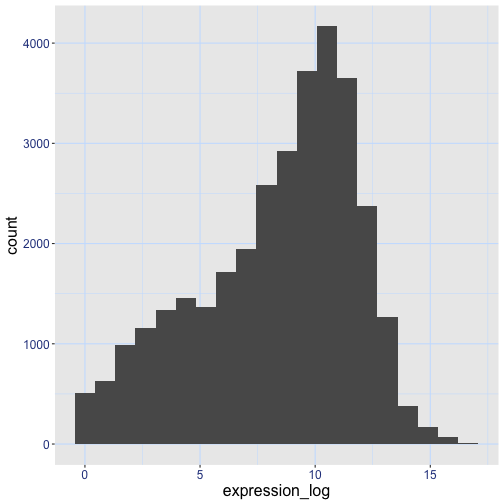
Imagen 1 de 1: ‘Histogram produced by ggplot() and geom_histogram() for the pre-computed log of expression.’
Figura 5
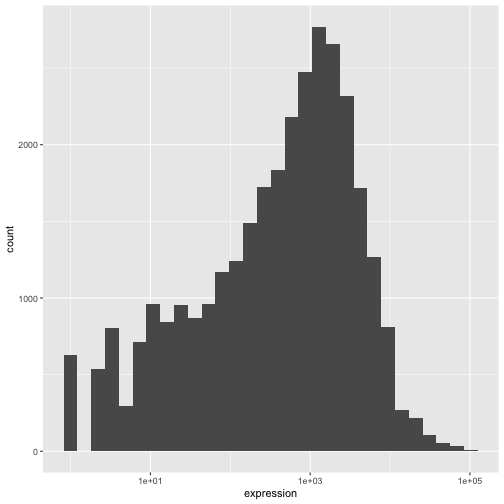
Imagen 1 de 1: ‘Histogram produced by ggplot(), geom_histogram() and scale_x_log10() for the log of expression.’
Figura 6
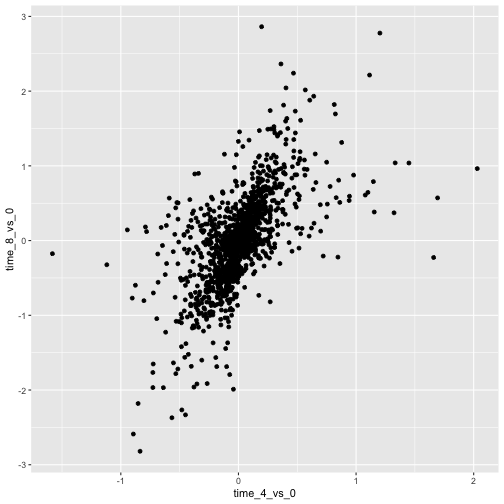
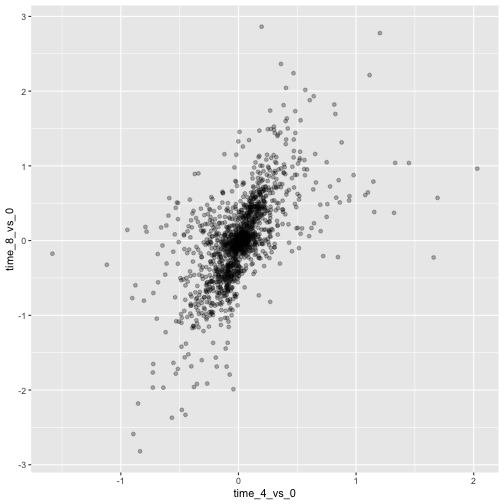
Imagen 1 de 1: ‘Scatter plot produced by ggplot() and geom_point() comparing the log-foldchanges computed above. All dots are black.’
Figura 7
Imagen 1 de 1: ‘Scatter plot produced by ggplot() and geom_point() comparing the log-foldchanges computed above. All dots are semi-transparent black.’
Figura 8
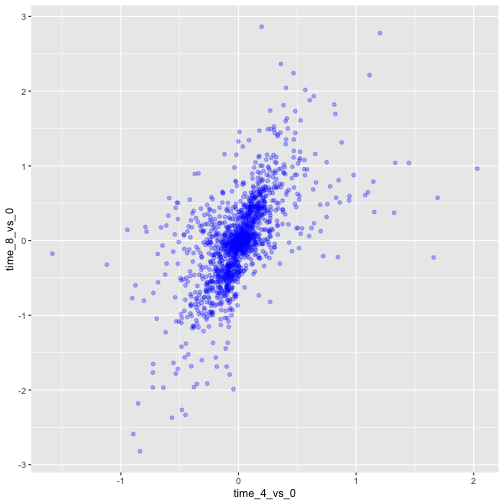
Imagen 1 de 1: ‘Scatter plot produced by ggplot() and geom_point() comparing the log-foldchanges computed above. All dots are semi-transparent blue.’
Figura 9
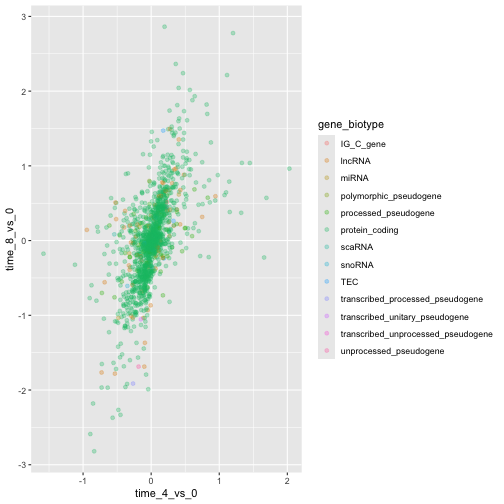
Imagen 1 de 1: ‘Scatter plot produced by ggplot() and geom_point() comparing the log-foldchanges computed above. Dots are colour-coded based on the gene's biotype.’
Figura 10
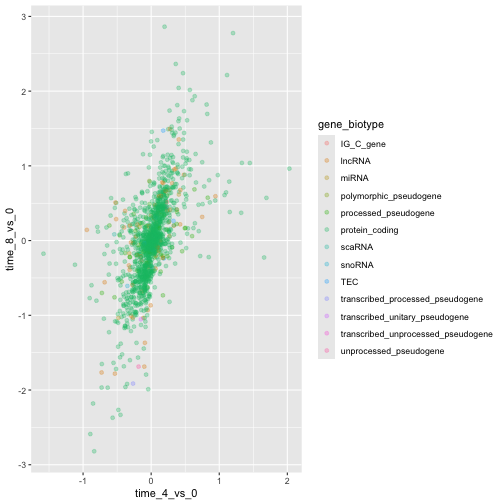
Imagen 1 de 1: ‘Scatter plot produced by ggplot() and geom_point() comparing the log-foldchanges computed above. Dots are colour-coded based on the gene's biotype.’
Figura 11
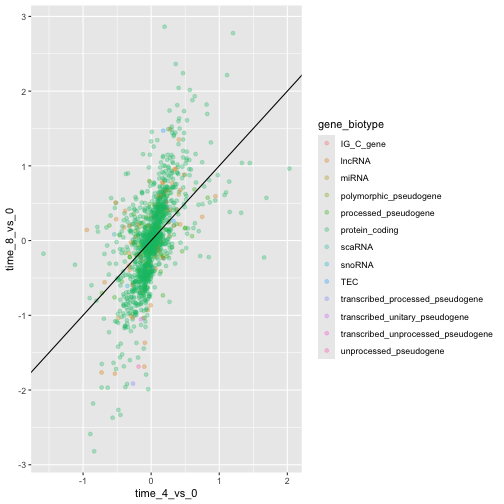
Imagen 1 de 1: ‘Scatter plot produced by ggplot() and geom_point() comparing the log-foldchanges computed above. Dots are colour-coded based on the gene's biotype. A black line of slope 1 crossing the origin was added by geom_abline().’
Figura 12
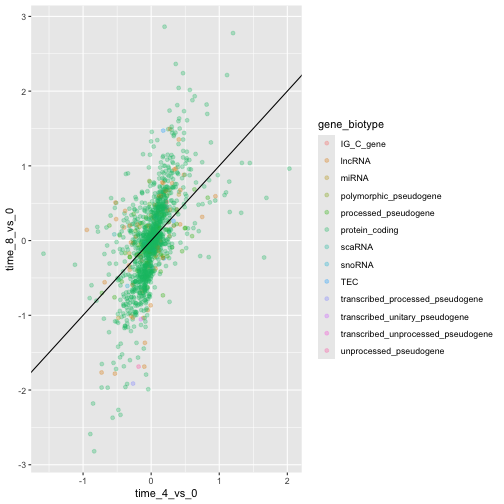
Imagen 1 de 1: ‘Scatter plot produced by ggplot() and geom_point() comparing the log-foldchanges computed above. Dots are colour-coded based on the gene's biotype. A black line of slope 1 crossing the origin was added by geom_abline().’
Figura 13
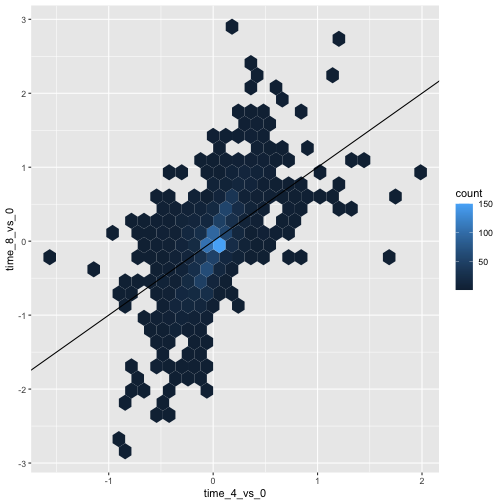
Imagen 1 de 1: ‘Scatter plot produced by ggplot() and geom_hexbin() comparing the log-foldchanges computed above shows hexagons coloured based on the underlying dot density. A black line of slope 1 crossing the origin was added by geom_abline().’
Figura 14
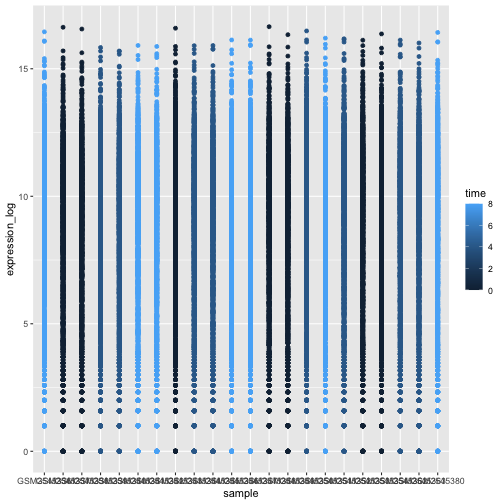
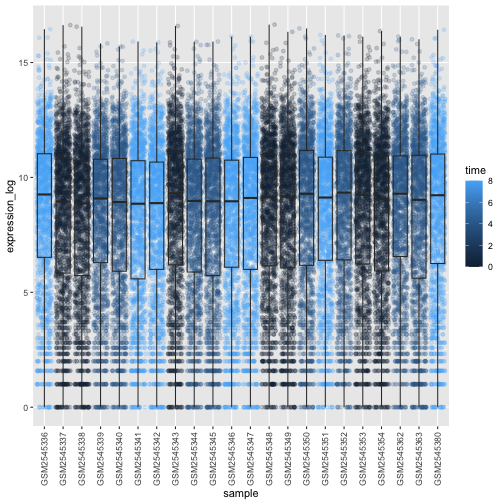
Imagen 1 de 1: ‘Figures showing a stretch of overlapping points indicating the log of expression + 1 for each sample. The points are coloured with different shades of blue for samples collected at different time points.’
Figura 15
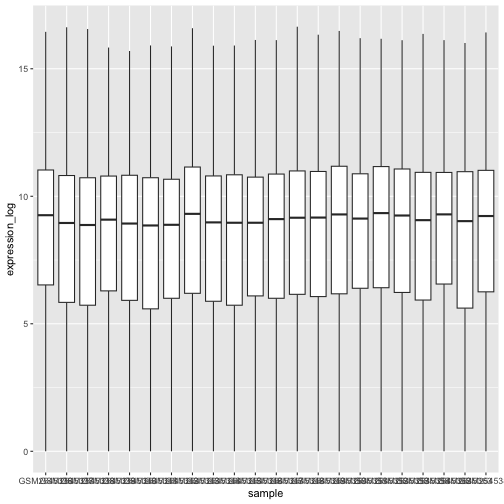
Imagen 1 de 1: ‘Boxplot showing the distribution of log expression + 1 values for each sample, as produced by geom_boxlpot(). Each boxplot is filled with white colour.’
Figura 16
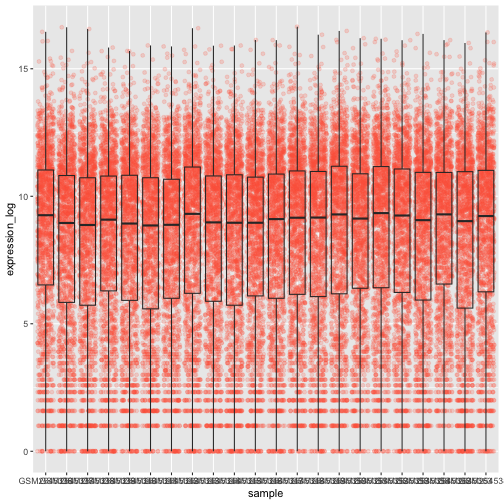
Imagen 1 de 1: ‘Boxplot and dots showing the distribution of log expression + 1 values for each sample, as produced by geom_boxlpot(). Each boxplot is transparent and the jittered dots are semi-transparent tomato-coloured and behind the boxpots.’
Figura 17
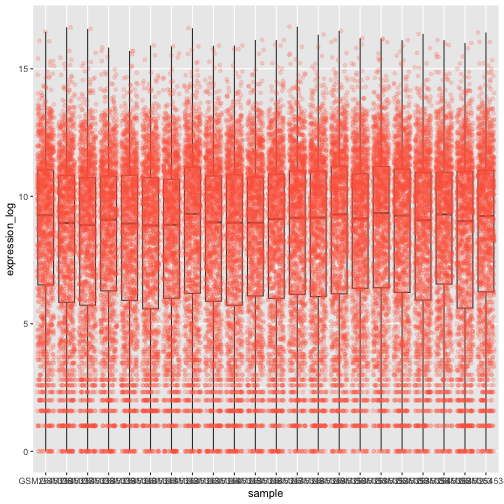
Imagen 1 de 1: ‘Boxplot and dots showing the distribution of log expression + 1 values for each sample, as produced by geom_boxlpot(). Each boxplot is transparent and the jittered dots are semi-transparent tomato-coloured. This time, the boxplots are behind the dots.’
Figura 18
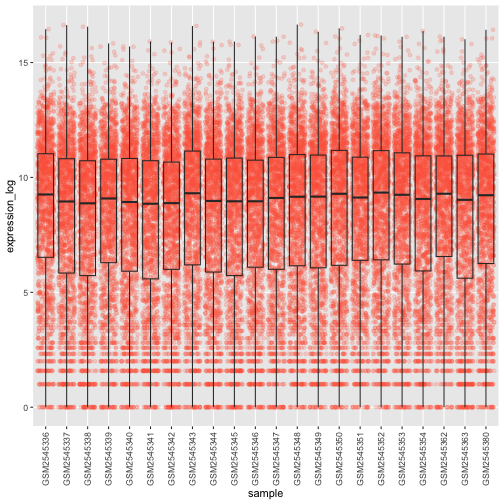
Imagen 1 de 1: ‘Boxplot and dots showing the distribution of log expression + 1 values for each sample, as produced by geom_boxlpot(). Each boxplot is transparent and the jittered dots are semi-transparent tomato-coloured. The sample labels are displayed vertically and readable.’
Figura 19
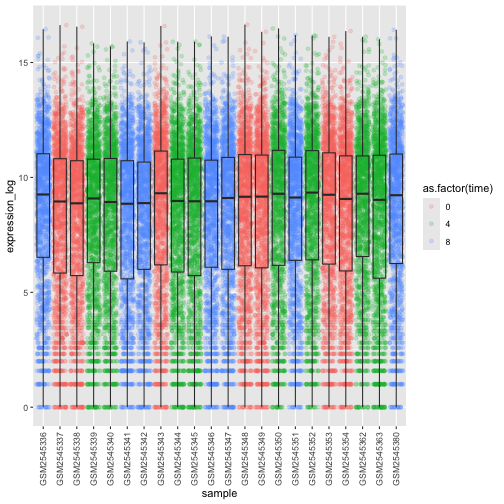
Imagen 1 de 1: ‘Boxplot and dots showing the distribution of log expression + 1 values for each sample, as produced by geom_boxlpot(). On the first figure, each boxplot is transparent and the jittered dots are semi-transparent and coloured in different shares of blue. On the second figures, each boxplot is transparent and the jittered dots are semi-transparent and coloured red, green and blue.’
Figura 20
Imagen 1 de 1: ‘Boxplot and dots showing the distribution of log expression + 1 values for each sample, as produced by geom_boxlpot(). On the first figure, each boxplot is transparent and the jittered dots are semi-transparent and coloured in different shares of blue. On the second figures, each boxplot is transparent and the jittered dots are semi-transparent and coloured red, green and blue.’
Figura 21
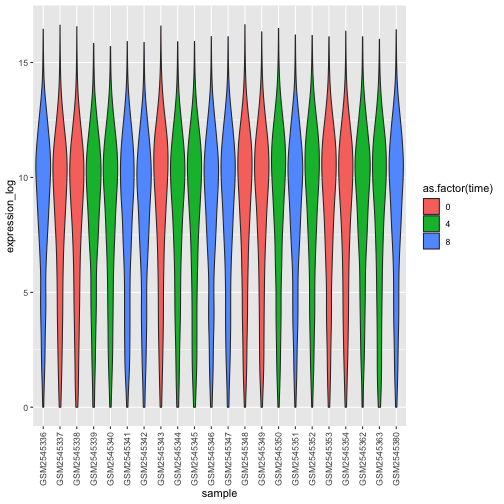
Imagen 1 de 1: ‘Violin plot showing the distribution of log expression + 1 values for each sample, as produced by geom_violin(). Each boxplot is transparent and the jittered dots are semi-transparent and coloured red, green and blue.’
Figura 22
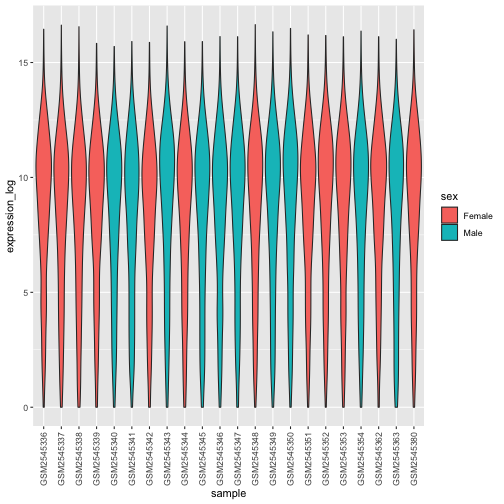
Imagen 1 de 1: ‘Violin plot showing the distribution of log expression + 1 values for each sample, as produced by geom_violon(). Each violin plot is coloured in red or blue depending on the sex variable.’
Figura 23
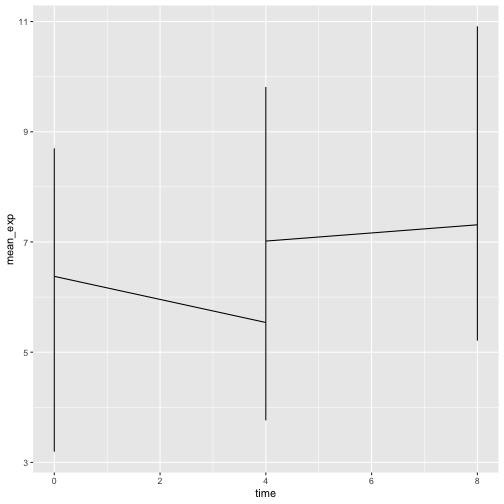
Imagen 1 de 1: ‘Line plot, as produced by geom_line(), but the lines are clearly not show what we expect.’
Figura 24
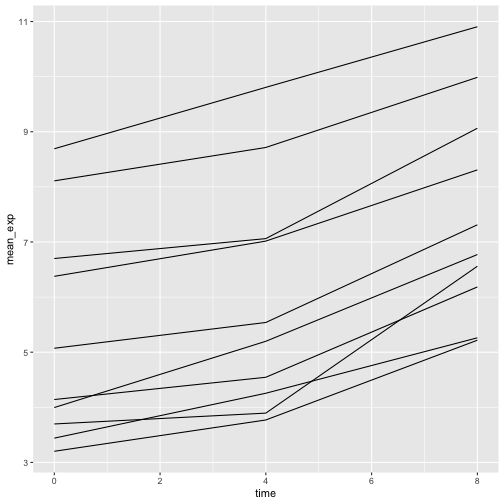
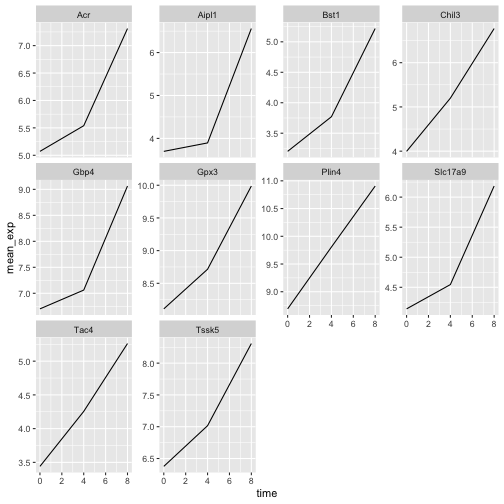
Imagen 1 de 1: ‘Line plot, as produced by geom_line(), with 10 lines showing increasing expression values over time.’
Figura 25
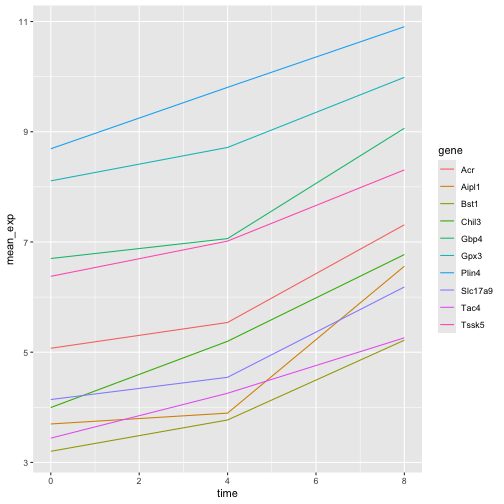
Imagen 1 de 1: ‘Line plot, as produced by geom_line(), with 10 colour-coded lines showing increasing expression values over time.’
Figura 26
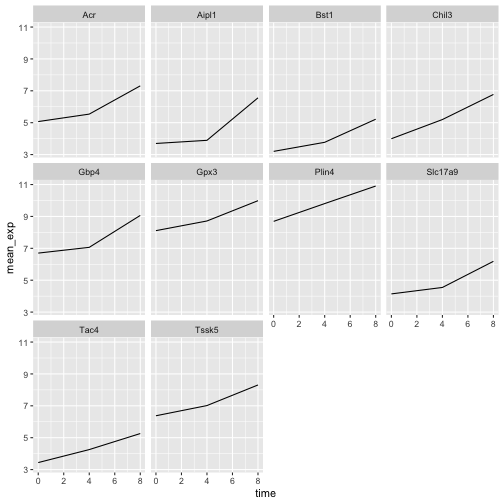
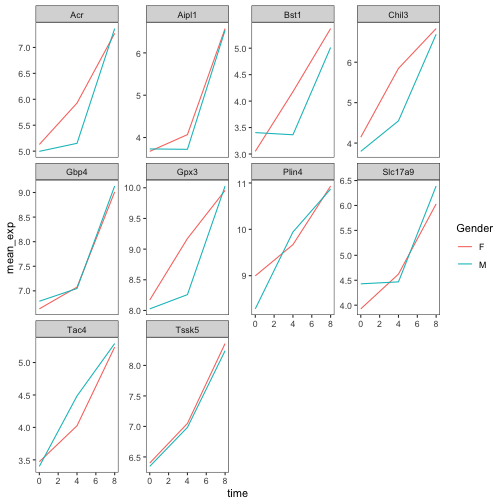
Imagen 1 de 1: ‘Line plot, as produced by geom_line(), with 10 sub-plots/facets, each showing one line with increasing expression values over time. All y-scales are identical.’
Figura 27
Imagen 1 de 1: ‘Line plot, as produced by geom_line(), with 10 sub-plots/facets, each showing one line with increasing expression values over time. y-scales are now adapted to the expression range for each facet/gene.’
Figura 28
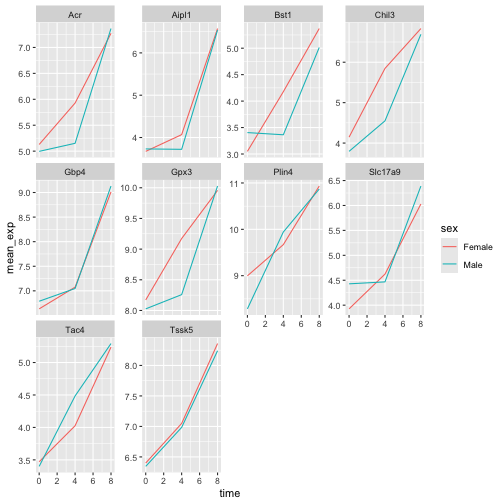
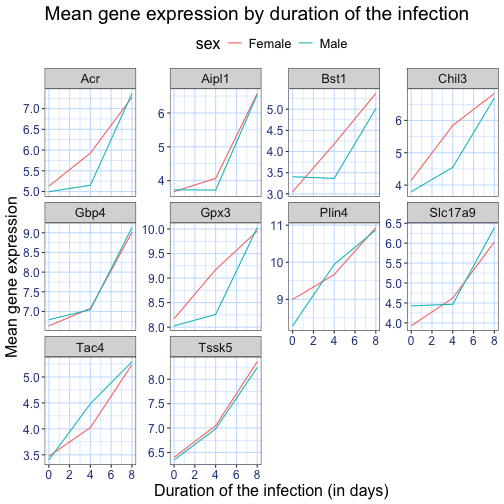
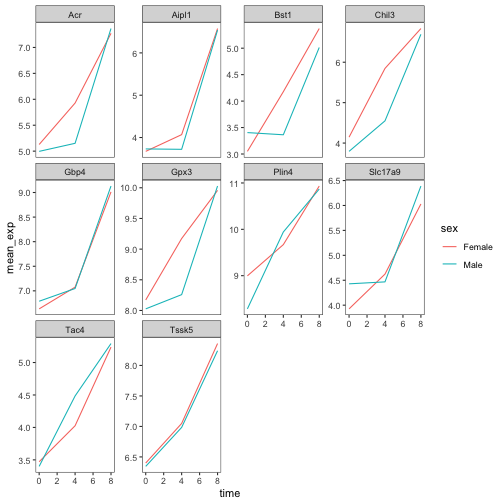
Imagen 1 de 1: ‘Line plot, as produced by geom_line(), with 10 sub-plots/facets, each showing two coloured lines (red for Female and blue for Make) with increasing expression values over time.’
Figura 29
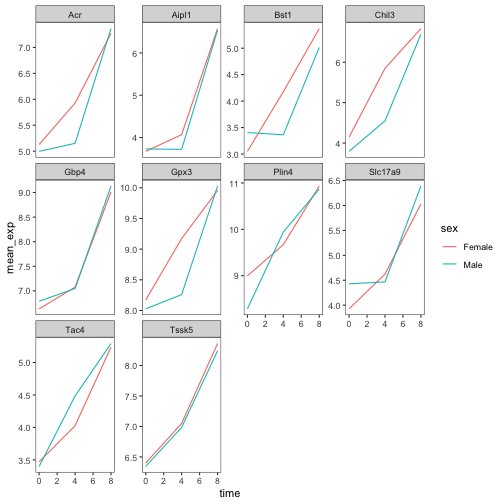
Imagen 1 de 1: ‘Line plot, as produced by geom_line(), with 10 sub-plots/facets, each showing two coloured lines (red for Female and blue for Make) with increasing expression values over time. The figure background is now white.’
Figura 30
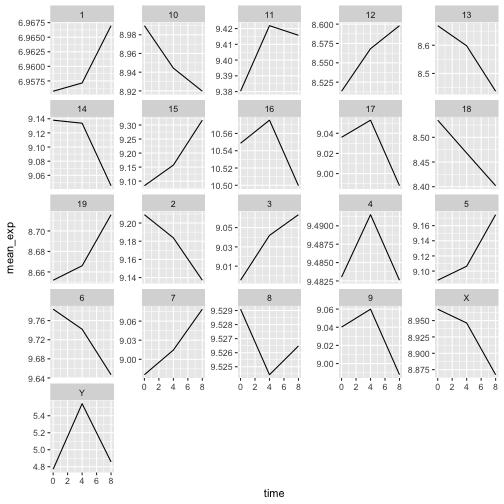
Imagen 1 de 1: ‘Line plot, as produced by geom_line(), with 21 sub-plots/facets, each showing one line with expression values over time for each chromosome.’
Figura 31
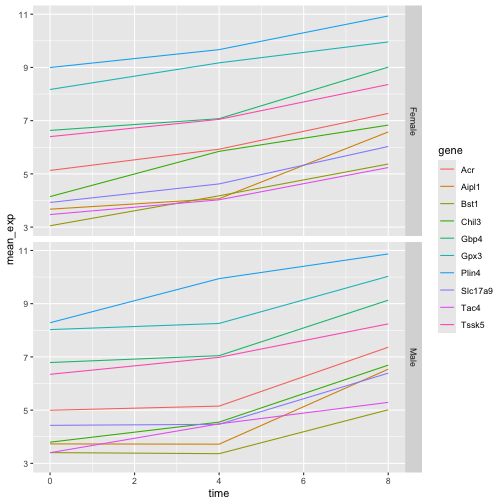
Imagen 1 de 1: ‘Two line plots above each other, each showing 10 lines coloured by gene. The top facet shows the expression values for Female sample, the bottom one for Male samples.’
Figura 32
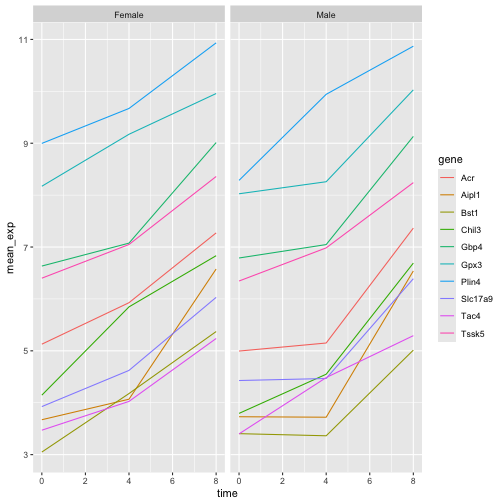
Imagen 1 de 1: ‘Two line plots next to each other, each showing 10 lines coloured by gene. The left facet shows the expression values for Female sample, the right one for Male samples.’
Figura 33
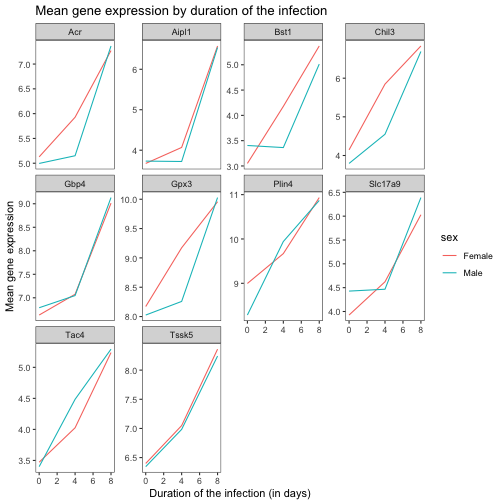
Imagen 1 de 1: ‘Line plot with white background and custom title and axis legends.’
Figura 34
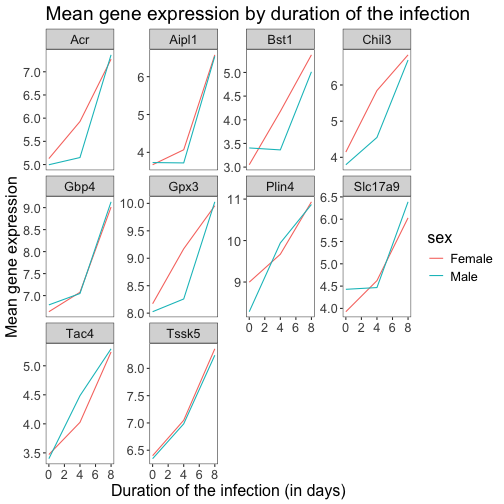
Imagen 1 de 1: ‘Line plot with white background and larger custom title and axis legends.’
Figura 35
Imagen 1 de 1: ‘Line plot with white background and larger custom title and axis legends and blue grid.’
Figura 36
Imagen 1 de 1: ‘Custrom 'blue_theme() showing a blue grid and blue axis legends.’
Figura 37
Imagen 1 de 1: ‘Plain facetted line plot, as produced by theme_bw() and a blank grid above.’
Figura 38
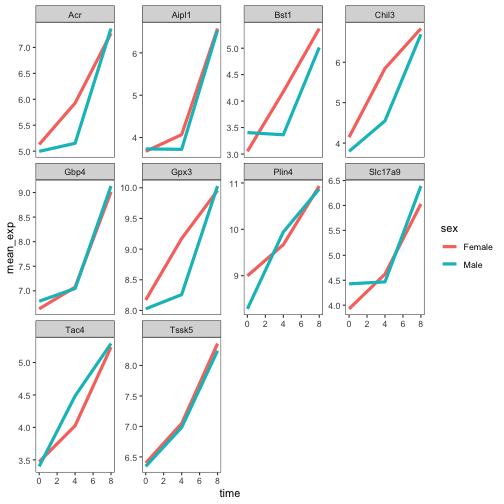
Imagen 1 de 1: ‘Plain facetted line plot, as produced by theme_bw() and a blank grid with wide lines.’
Figura 39
Imagen 1 de 1: ‘Plain facetted line plot, as produced by theme_bw() and a blank grid with renamed colour labels.’
Figura 40
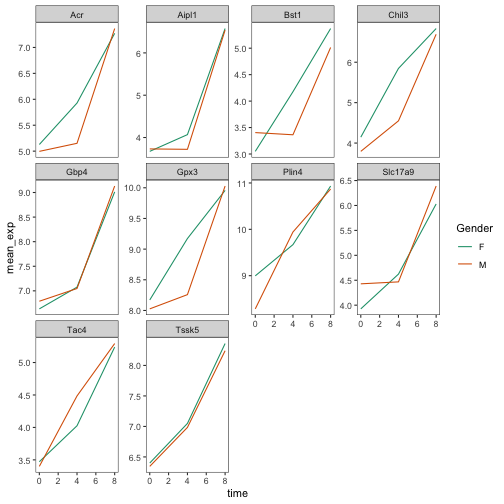
Imagen 1 de 1: ‘Plain facetted line plot, as produced by theme_bw() and a blank grid with a different color palette and renamed colour labels.’
Figura 41
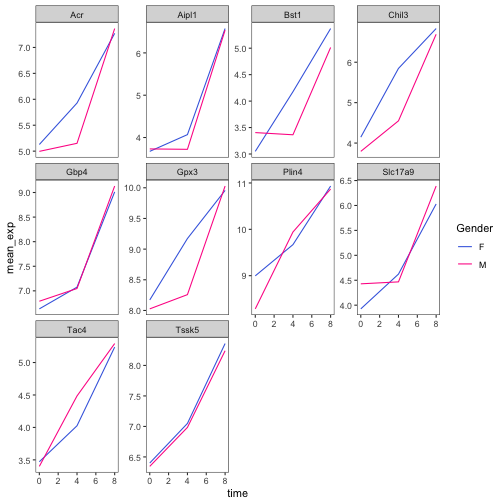
Imagen 1 de 1: ‘Plain facetted line plot, as produced by theme_bw() and a blank grid with a manually-set colors and renamed colour labels..’
Figura 42
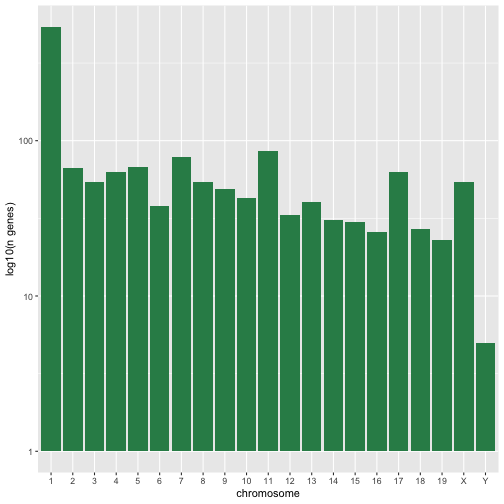
Imagen 1 de 1: ‘A simple histogram with greed bars showing the log10 number of genes per chromosome.’
Figura 43
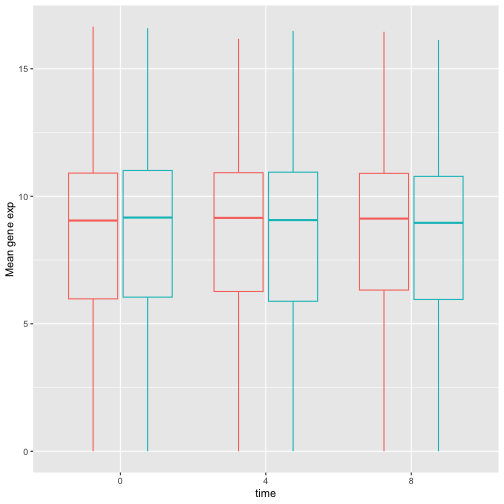
Imagen 1 de 1: ‘Transparently-filled red and blue boxplots for Female and Male expression values for different time points.’
Figura 44
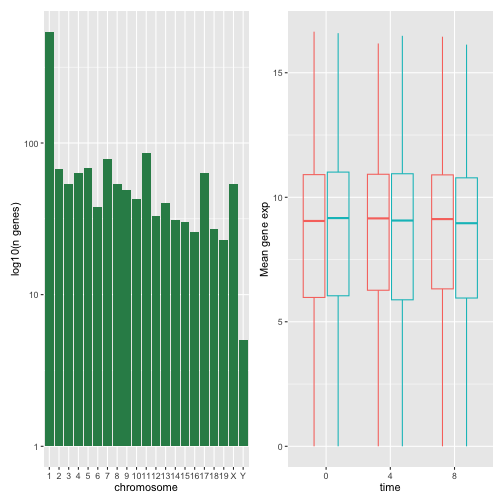
Imagen 1 de 1: ‘A composed figure show the histogram (left) and boxplots (right) next to each other.’
Figura 45
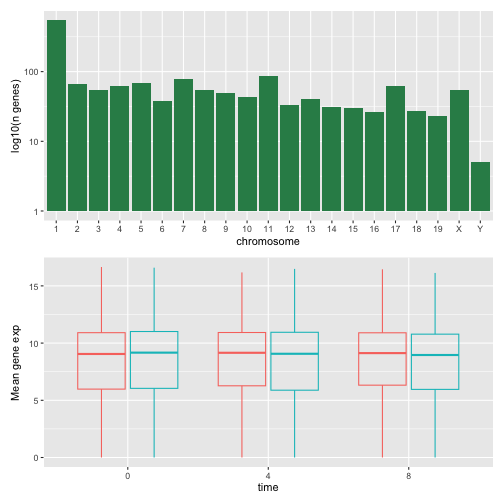
Imagen 1 de 1: ‘A composed figure show the histogram (top) and boxplots (bottom) on top or each other.’
Figura 46
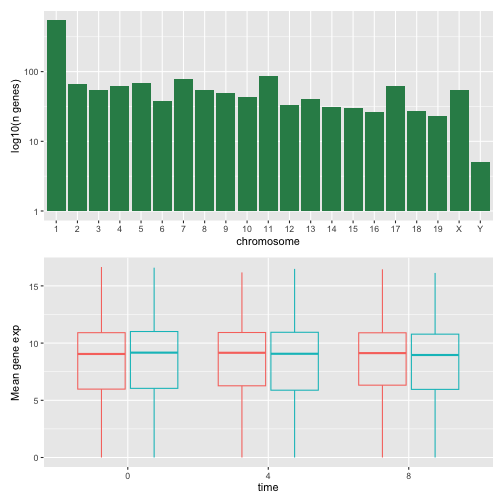
Imagen 1 de 1: ‘A composed figure show the histogram (top) and boxplots (bottom) on top or each other.’
Figura 47
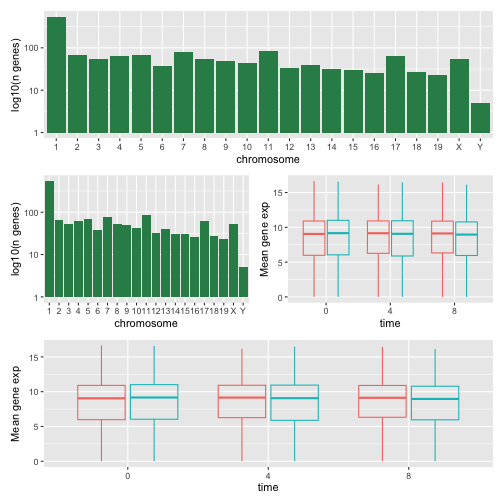
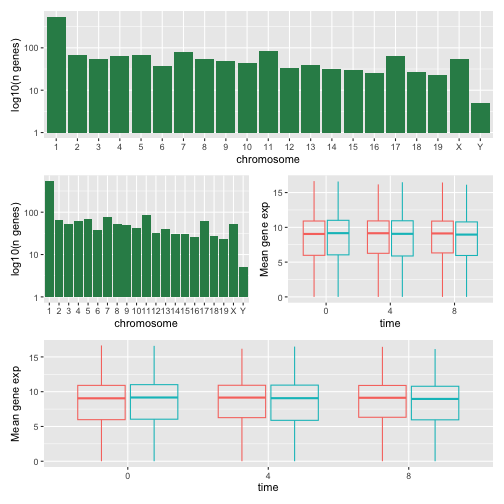
Imagen 1 de 1: ‘A figure composed of 4 plots with on top the histogram, in the middle the histogram and the boxpot, side-by-side, and at the bottom, the boxplot.’
Figura 48
Imagen 1 de 1: ‘As above, a figure composed of 4 plots with on top the histogram, in the middle the histogram and the boxpot, side-by-side, and at the bottom, the boxplot.’
Figura 49
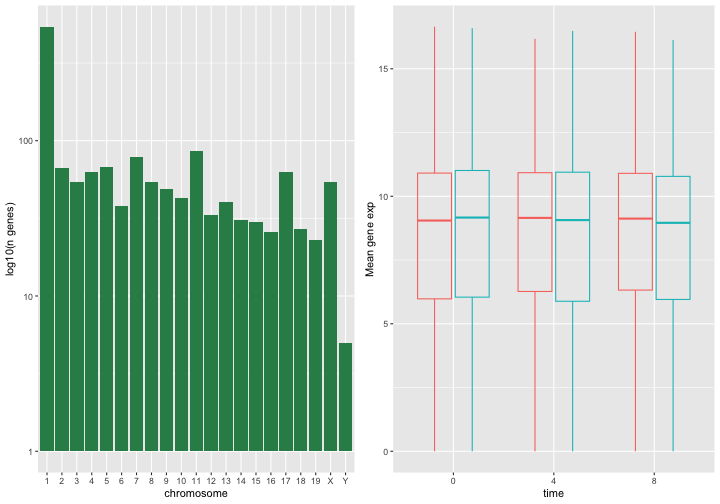
Imagen 1 de 1: ‘A composed figure with the histogram (left) and boxplot (right) side-by-side.’
Figura 50
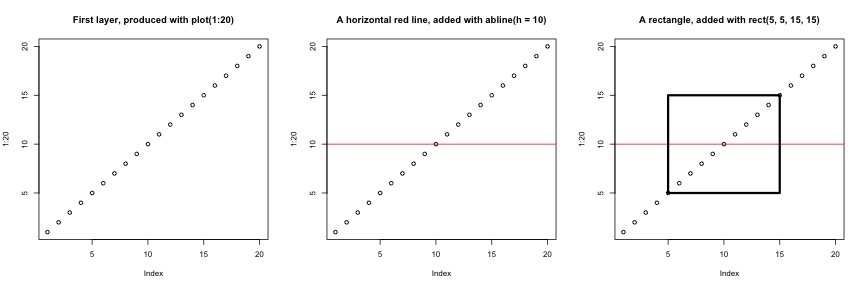
Imagen 1 de 1: ‘The 'base' figures, side-by-side, showing (from left to right) 20 empty dots along the diagonal, same with a vertical red line, and same as the second one with a rectangle overlaid in the middle of the plot.’
Successive layers added on top of each other.
Figura 51
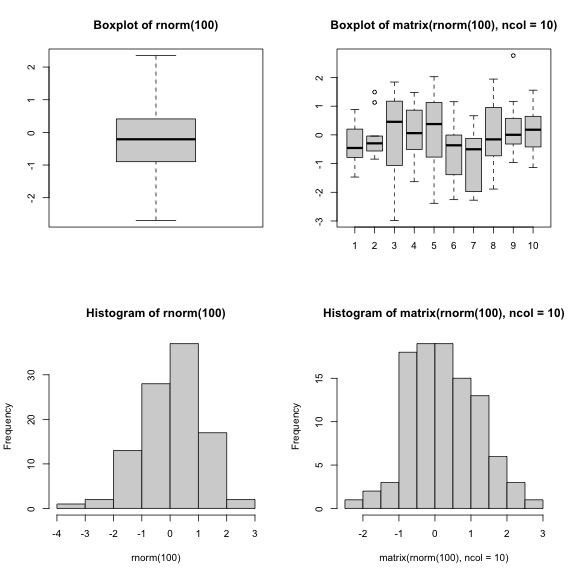
Imagen 1 de 1: ‘A two-by-two composition of 2 boxplots at the top, and 2 histograms at the bottom.’
Plotting boxplots (top) and histograms (bottom) vectors (left) or a
matrices (right).
Imagen 1 de 1: ‘Schematic representation of the SummarizedExperiment class illustrating the following slots: fowData and rowRanges, one assay or multiple assays, colData and metadata.’
Figura 2
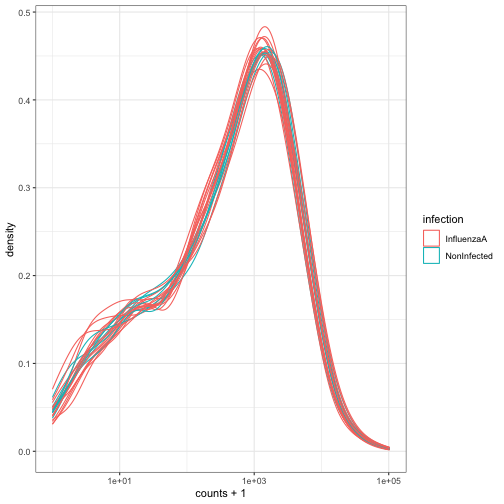
Imagen 1 de 1: ‘Density plot showing log of expression counts + 1 density lines, one per samples, coloured based on the infection status.’